When's the best time for back-to-school shopping?
Visualping tracked 820 back-to-school products at 10 US retailers every day from July 15 to September 8, 2026, and recorded every price change. Here is when each category was cheapest, how quickly certain sales came back, and what Labor Day weekend actually did.
Key findings
Late July was the cheapest week to buy clothing. The week of July 27 was the lowest, and prices rose 7.8% by mid-August.
Early August was the cheapest week to buy shoes. The week of August 3 was the lowest, and shoes that repriced sat 11% below their July price that week.
Eight days was the median gap before a product that had just been discounted went on sale again. Missing a sale rarely cost much.
School supplies and electronics never had a cheapest week. Their price baskets moved within 3.4% and 2.0% all season.
Clothing was cheapest in late July, shoes in early August.Supplies and electronics never had a cheapest week.
The best time for back-to-school shopping highly depended on the category. On average, children's clothing prices were lowest in late July, while shoes saw the best discounts in early August. School supplies and electronics didn't have a definitive best sale period.
Median time before a discounted product was discounted again. 73% of repeat discounts came within two weeks.
Products whose price changed at least once in eight weeks: 352 of 820. The other 468 had no confirmed price change.
When a price changed, it typically moved 18% up or down from the previous price. 132 products ended higher, 139 lower, 81 back where they started.
Shoes saw the deepest discounts of any category. Among shoes whose price changed, the average price in the week of August 3 was 11% below where those shoes started in July, and still 5% below on September 8.
Which weeks were cheapest, category by category
Weekly price index by category, July 13 to September 7, 2026. Every product starts at 100, so a category at 104 is 4% above its starting prices. Hover over a week to compare the four categories.
How to read this: every product's first observed price is set to 100. A category at 104 means its prices averaged 4% above where they started, and 97 means 3% below. A week's value is the price that was in effect on the most days of that week, so a one-day blip does not define the week. Dots mark each category's lowest week.
All products: the average includes every product in the category, including the 468 whose price never changed (held at 100).
When repriced products hit their season low
For every product whose price changed, we found the week its price was lowest. Each chart shows the share of a category's repriced products by that week. The darker bar is the most common low week for the category; the shaded background is July.
🎒 Supplies · 35 repriced products
Most common low: week of Jul 13 (43% of repriced supplies)
👕 Clothing · 157 repriced products
Most common low: week of Jul 13 (32% of repriced clothing)
👟 Shoes · 55 repriced products
Most common low: week of Aug 3 (38% of repriced shoes)
💻 Electronics · 105 repriced products
Most common low: week of Jul 13 (43% of repriced electronics)
Where prices ended the season versus where they started
Products with at least one verified price change. "Back at start" means the last price we observed equals the first.
Deals that ended before Labor Day, and discounts that lasted
On average, back-to-school promotional prices came off in two waves, one at the end of July and another from August 30 to September 7. The products on the left were at their best price of the season before Labor Day and returned to regular pricing once school started. The ones on the right were marked down and stayed at the lower price through September 8. Each chart is the product's actual price from our daily checks.
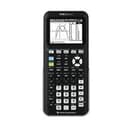
TI-84 Plus CE graphing calculator
Staples. 2 price changes, +6% by September 8. Hover a step to read the price.
$89.99 from August 30 to September 6, the best price of the season. $129.99 from September 7.
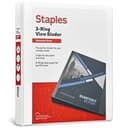
Staples 1-inch 3-ring view binder
Staples. 2 price changes, +189% by September 8. Hover a step to read the price.
The $3.99 back-to-school price ran until August 30. From then on the page showed $10.09.


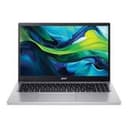
Acer Aspire Lite 15.6-inch student laptop
Staples. 1 price change, -20% by September 8. Hover a step to read the price.
$249.99 to $199.99 on August 2, and it stayed there through September 8.
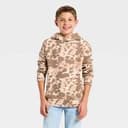
Boys' fleece animal-print hoodie
Target. 7 price changes, -41% by September 8. Hover a step to read the price.
$17.00 to $10.00 in seven weekly $1 steps from July 19 to August 30, and it never went back up.

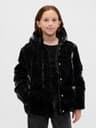

The sale that comes back
Another finding shoppers can use: the same product often went on sale more than once, and the next markdown usually arrived within a week or two. Each chart below is one product's actual price, day by day, from our monitoring.

Cat & Jack boys' uniform pants
Target. 4 price changes, ended where it started. Hover a step to read the price.
$16.00 to $11.20 in the weeks of July 26 and August 9, back to $16.00 each time.
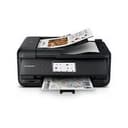
Canon PIXMA TR8620a printer
Staples. 6 price changes, +8% by September 8. Hover a step to read the price.
Moved between $199.99 and $215.99 six times.
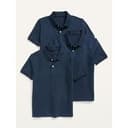
School uniform polo 3-pack for boys
Old Navy. 6 price changes, ended where it started. Hover a step to read the price.
$49.99 to $24.99 twice in July and to $29.99 in August, restored within a week each time.
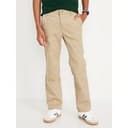
Uniform straight-leg pants for boys
Old Navy. 12 price changes, +12% by September 8. Hover a step to read the price.
12 price changes in eight weeks, always between $11.49 and $22.99.
How long sales took to come back
For every product that was marked down more than once, we measured the days between one price cut and the next.
Days between one price cut and the next on the same product
429 repeat cuts on 163 products. Hover a bar for the count.
How to plan back-to-school shopping
In the eight weeks before school started, prices on our 820 products changed 1,408 times. The typical product that changed price did so three times, 154 products changed four times or more, and a product that had just been discounted was discounted again a median of 8 days later.
All of this points to how unpredictable and overwhelming back-to-school shopping can be, and how an automated way of tracking deals can go a long way toward making your dollar stretch.
Here are a few tips to plan your back-to-school shopping.
- 1
Make the list before July
Clothing was cheapest in the week of July 27 and shoes in the week of August 3. Having the product pages picked out before then means you see the low the day it arrives instead of finding out after it has gone.
- 2
Put a free price alert on each page
A free price monitoring tool like Visualping checks a product page on a schedule and emails you a summary of what changed. Set a condition in plain language, such as "alert me when this drops below $12", and let the page tell you when it happens. The free plan covers 5 pages and 150 checks a month. For a longer list, personal plans start at 10 pages and 1,000 checks a month; see plans and pricing. How to set up price alerts, with retailer guides for Walmart and Amazon.
- 3
Check your alerts often, and watch for sales that come back
Make sure to check your inbox often for Visualping's alerts, and don't worry too much if you missed a sale. Our data shows that 73% of repeat discounts came within two weeks of the previous one, so waiting for the next alert usually cost less than paying full price.
Track a price before the next sale.
Visualping watches any product page and sends you an AI summary of what changed, with before-and-after screenshots. The free plan covers 5 pages and 150 checks a month.
Report methodology
Visualping monitored 820 products across four categories at 10 US retailers, weighted to the National Retail Federation's 2026 Back-to-School Survey shares of planned spend: electronics 33.9%, clothing 29.0%, shoes 20.1% and school supplies 17.0%. Products were drawn from each retailer's back-to-school and best-seller pages, and the school supplies list was cross-checked against TeacherLists. Only first-party listings were included. School supplies covered pens, pencils and markers, binders and folders, notebooks and paper, backpacks, glue, scissors and tape, lunch boxes and desk organizers. Clothing covered school uniforms, jeans and pants, tees and tops, underwear and socks, hoodies and sweatshirts, and outerwear. Shoes covered athletic and running shoes and casual canvas sneakers. Electronics covered laptops, tablets, printers, graphing calculators, monitors, headphones and speakers, and accessories such as keyboards, mice and chargers.
A Visualping monitor was created for each product and checked its page every day from July 15 to September 8, 2026. Each monitor was cropped to the price area of the page and used a custom Visualping AI importance rule scoped to the main product's current selling price, ignoring crossed-out prices, other sellers, related items and badges. Every change the AI judged important produced a written summary of what changed and before-and-after screenshots.
We read the prices out of each of the 2,837 summaries. 982 of them stated both prices, for example "from $3.99 to $10.09". 219 stated the new price and the previous one, for example "now $10.00, previously $7.49". 182 stated only the new price, and we took the previous price from the product's prior verified observation.
The result was 1,408 verified price changes on 352 products.
This is change-based monitoring, so for a product that never changed we know the price area of its page stayed the same. We did not record what that price was. About 2.5% of daily checks returned an error, such as a blocked request or a page that did not load; a price change on such a day was picked up by the next successful check, so some dates are a day or two late.
The AI reads each page the way our checker saw it: the US site, no account, no location or personalization, before tax and shipping, and excluding prices that required a code or a store card. Some products were mid-way through a Labor Day sale when tracking ended on September 8. The index is unweighted by price, so a $2 notebook counts as much as a $1,200 laptop; the "repriced products only" series caps each product between 50 and 200 so one extreme markdown cannot dominate the average.