What's New
The latest features & improvements — shipped regularly.
Filter your reports and dashboard faster
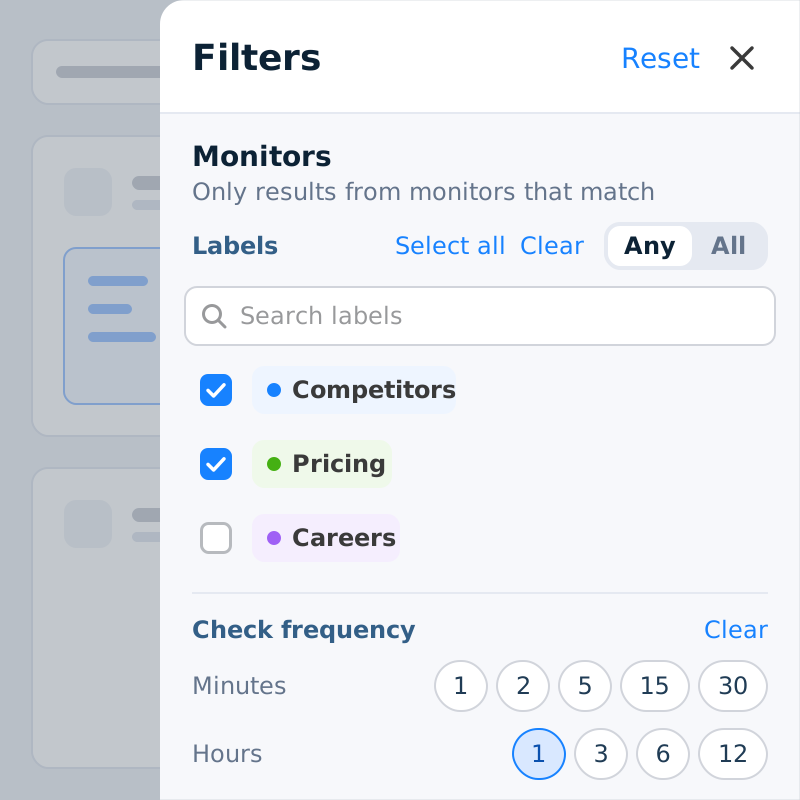
Filters on Reports and on your dashboard now open in the same side panel. Narrow results by label, check frequency, schedule or status with one-tap buttons. You can select or clear all labels in one click, and Reset puts everything back.
Spot failing monitors at a glance
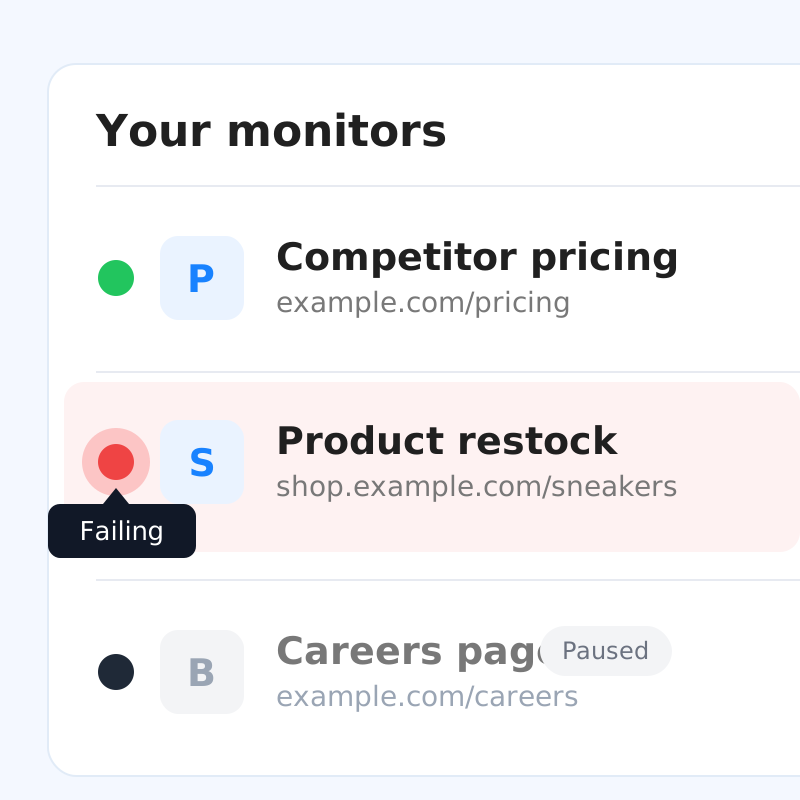
Every monitor in your dashboard now has a status dot. Green means it's checking as expected, red means it has failed several checks in a row, and grey means it's paused. Hover over a dot to see its status, and fix anything red before you miss a change.
Colour-code your flagged changes
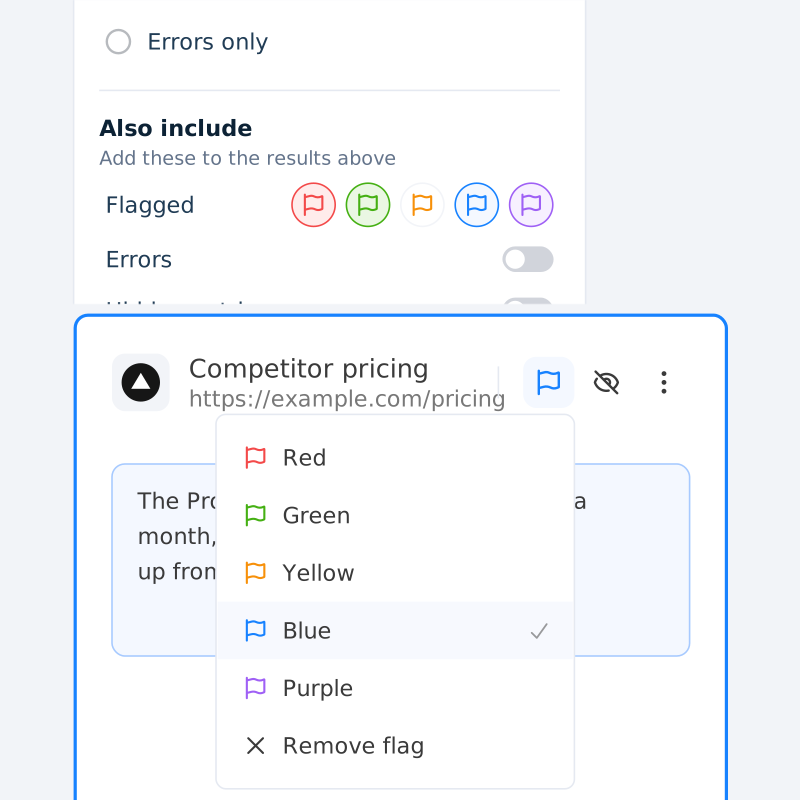
Flags now come in five colours, so you can sort changes your own way, like urgent, resolved or to review. Pick red, green, yellow, blue or purple from the flag on any change, then filter your Reports by colour.
See who flagged or hid each change, and when
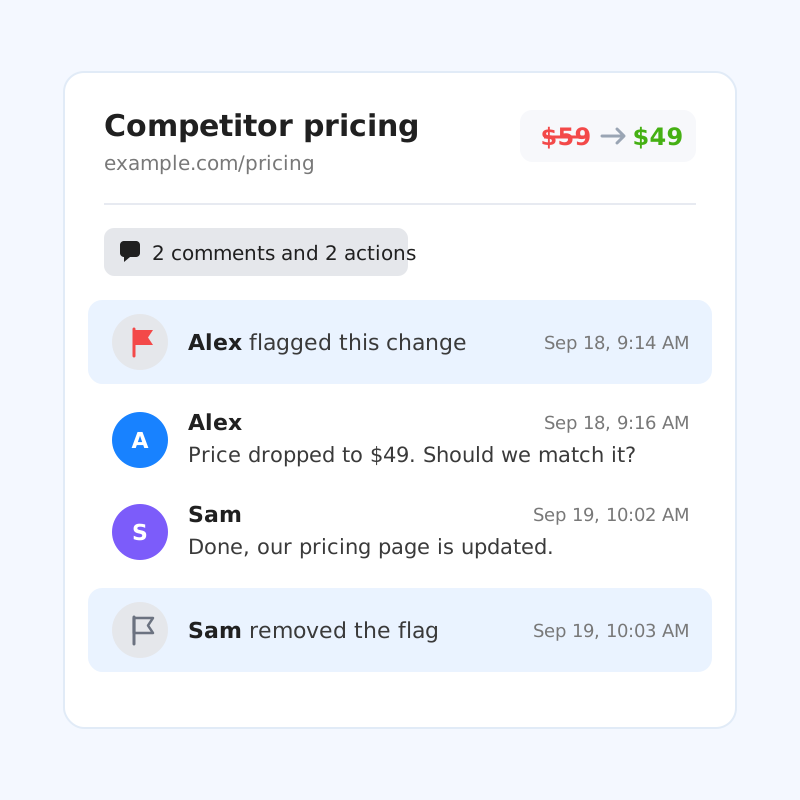
Every change on your Reports page now shows its full flag and hide history next to the comments, so you can see who flagged, unflagged, hid, or unhid it and when. It already covers changes your team flagged or hid before this update.
Never wonder if your monitors are still watching
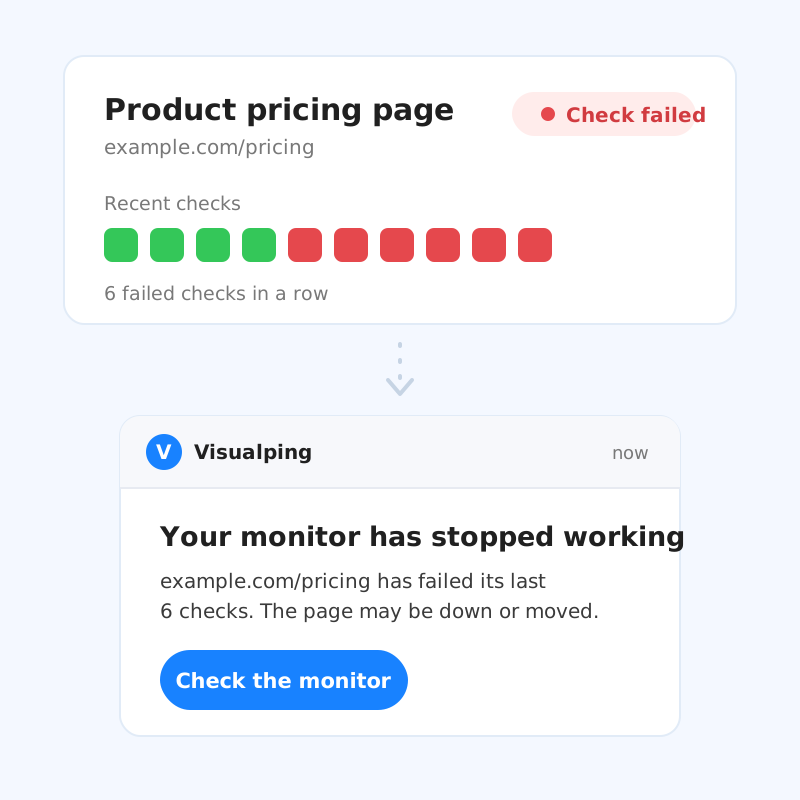
No more silent monitors quietly watching nothing. Visualping now emails you when a page stops working, whether it has gone down or moved. Want every error instead, or none at all? Both options are in the monitor's settings.
Send the same alert to every tool that needs it
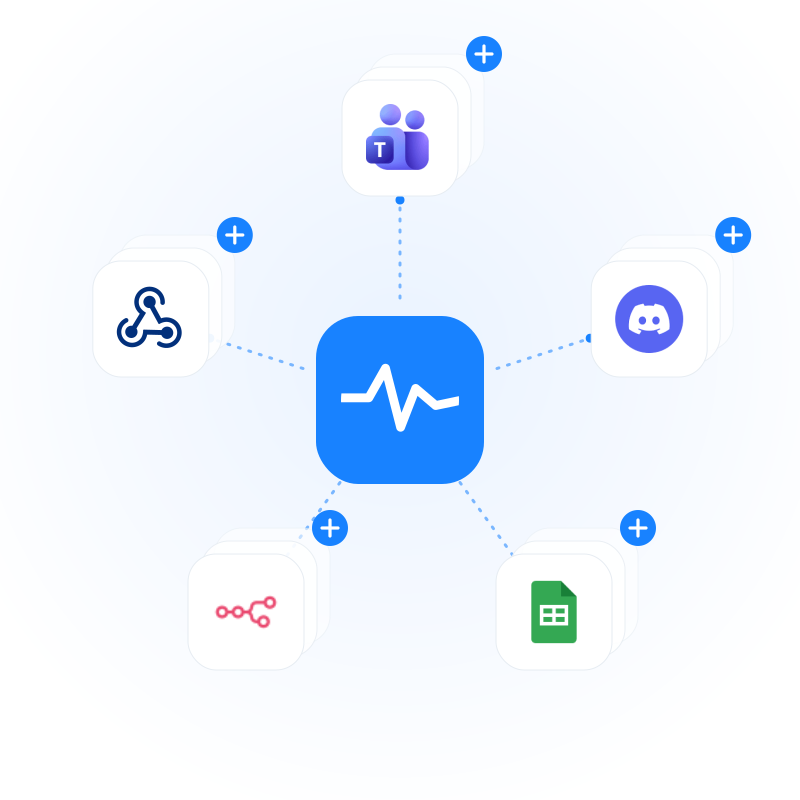
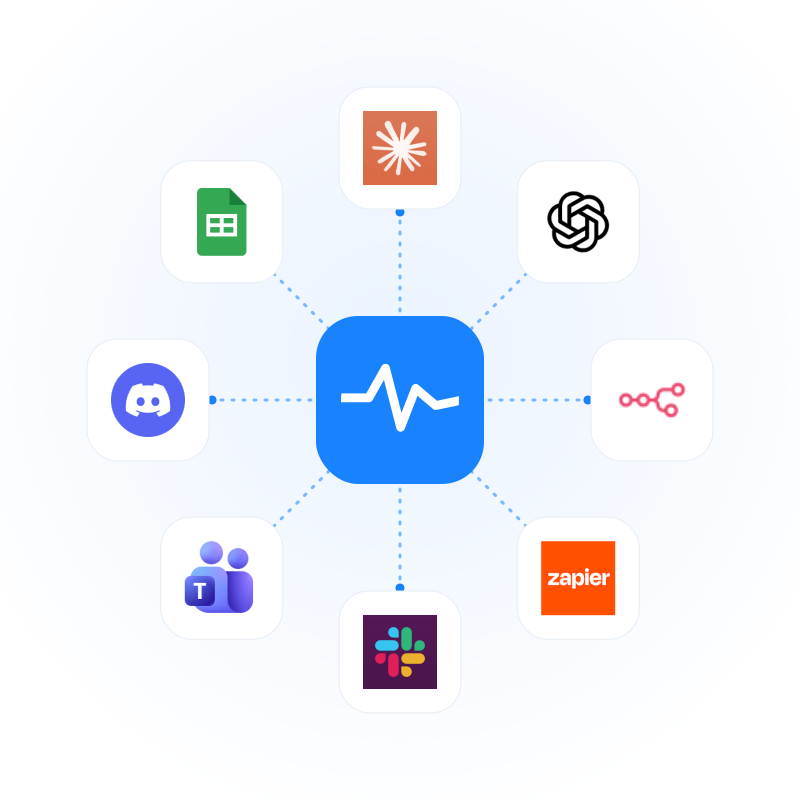
Webhooks, Teams, Discord, n8n, and Google Sheets now take up to five destinations each on a single monitor. Point one monitor at two Teams channels and a spreadsheet at once, and switch each destination on or off on its own.
Update all your monitors at once
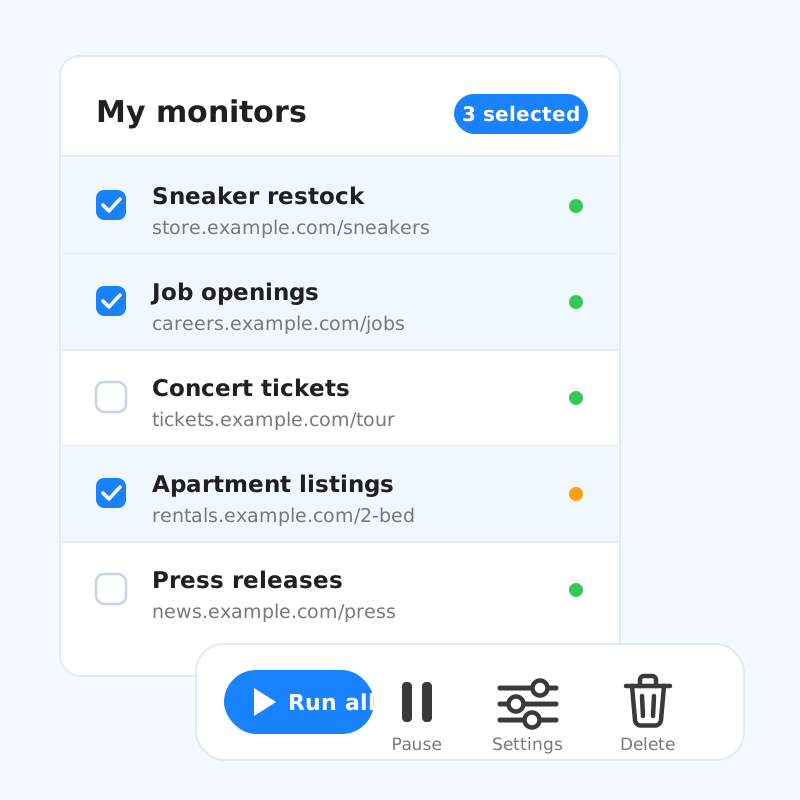
Bulk editing is now available on personal plans. Select multiple monitors from your list to pause, run, delete, or change settings like check frequency and notifications in one go, instead of editing them one at a time. Select-all makes sweeping changes across your whole list effortless.
Markdown pages now look the way they should
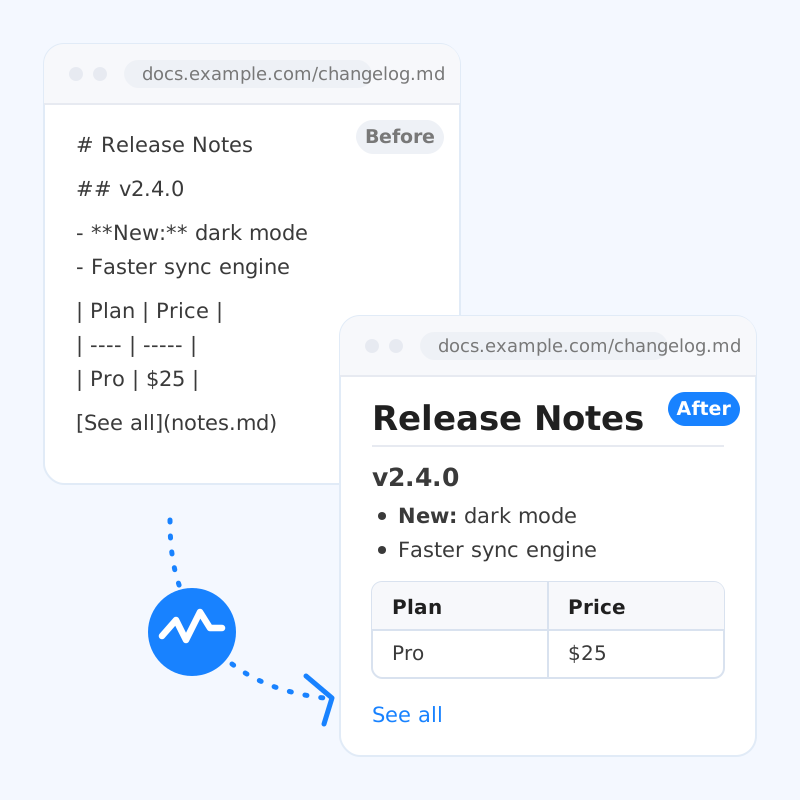
Monitoring a docs page or changelog served as markdown? Visualping now renders it as a clean, formatted page, so your screenshots, comparisons, and alerts show real headings, tables, and links instead of raw markdown syntax. It works automatically on all your monitors, existing and new.
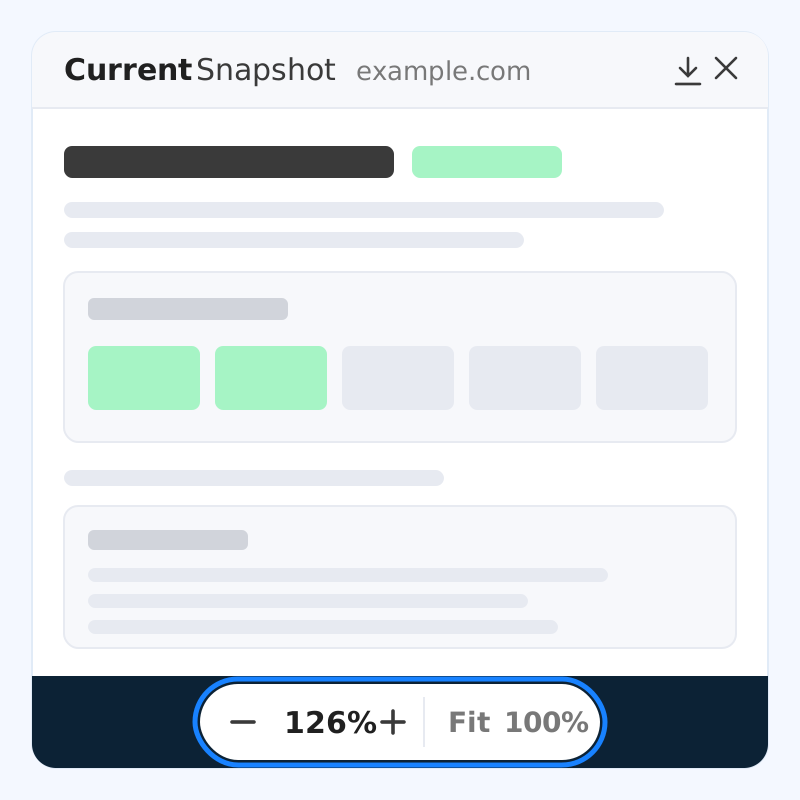
Zoom in on any screenshot in your reports
Every screenshot in your reports is now fully zoomable. Dive right into the smallest details, pull back for the full picture, and finally explore those very long page captures without squinting.
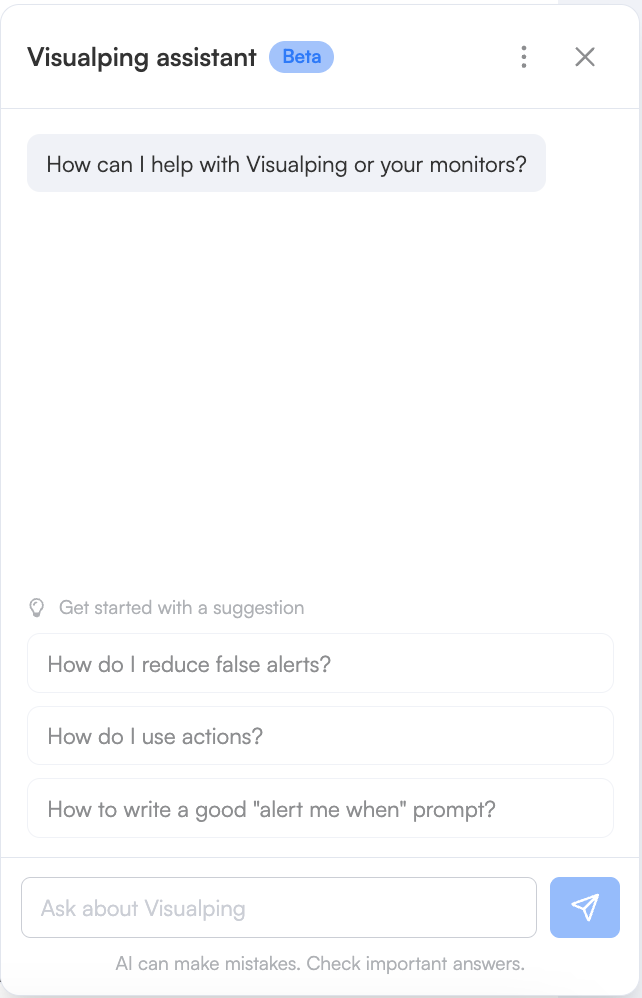
Meet the Visualping assistant
Every question about Visualping and your monitors now has an instant answer. Ask how to sharpen an alert, fix a noisy monitor, or get more out of your plan, and the assistant handles it on the spot. It's in beta and open to everyone, so give it a try!
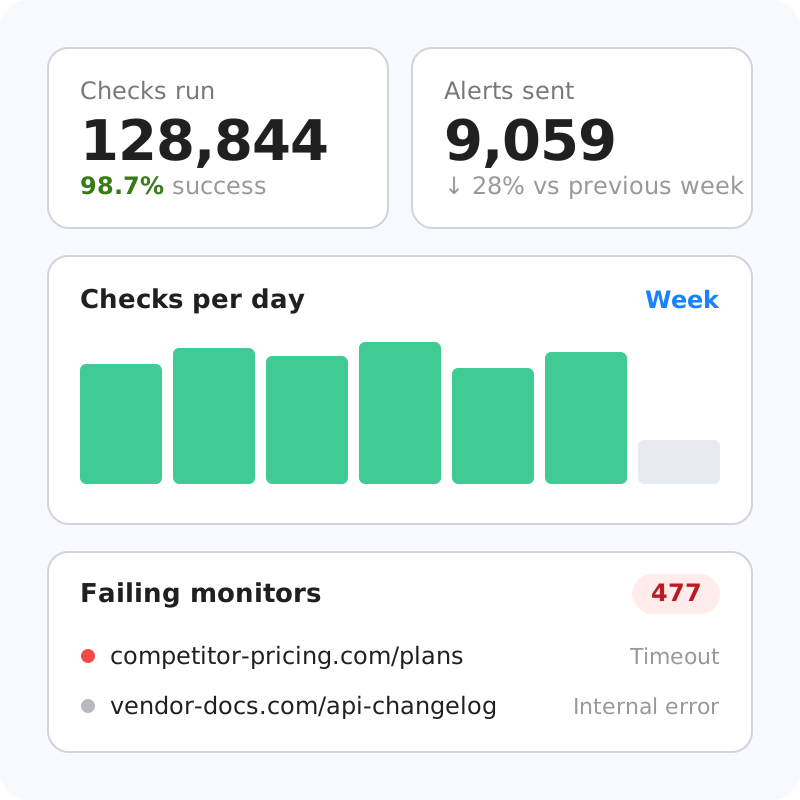
Know how your monitors are really doing
Your monitoring finally has a scoreboard. Checks run, alerts sent, success rates, and exactly where you stand against your plan, all in one view. Catch failing monitors before they go quiet on you, and see what's queued up next. Live now for everyone.
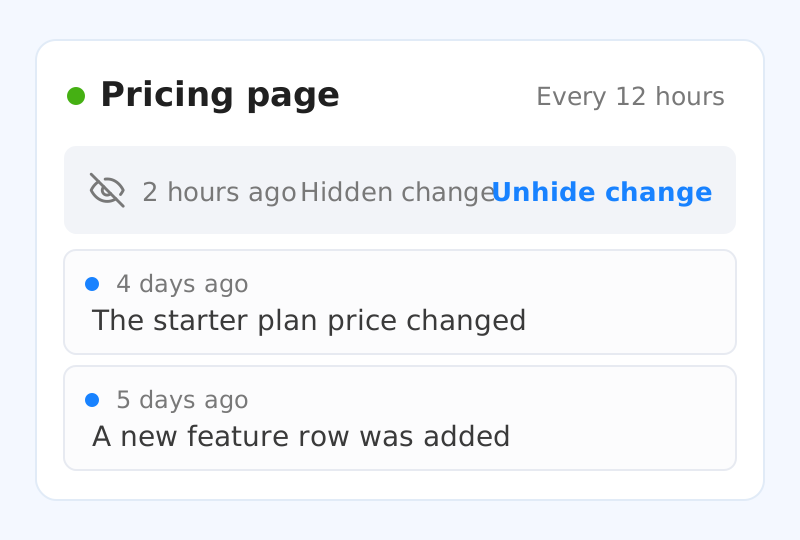
You can hide the changes you don't need to see
Not every detected change is worth a second look. Hide one and it collapses to a single muted line in your monitor timeline and drops out of your reports. Select Unhide change to bring it straight back, or turn on the Hidden entries filter in your reports to find it and unhide it there.
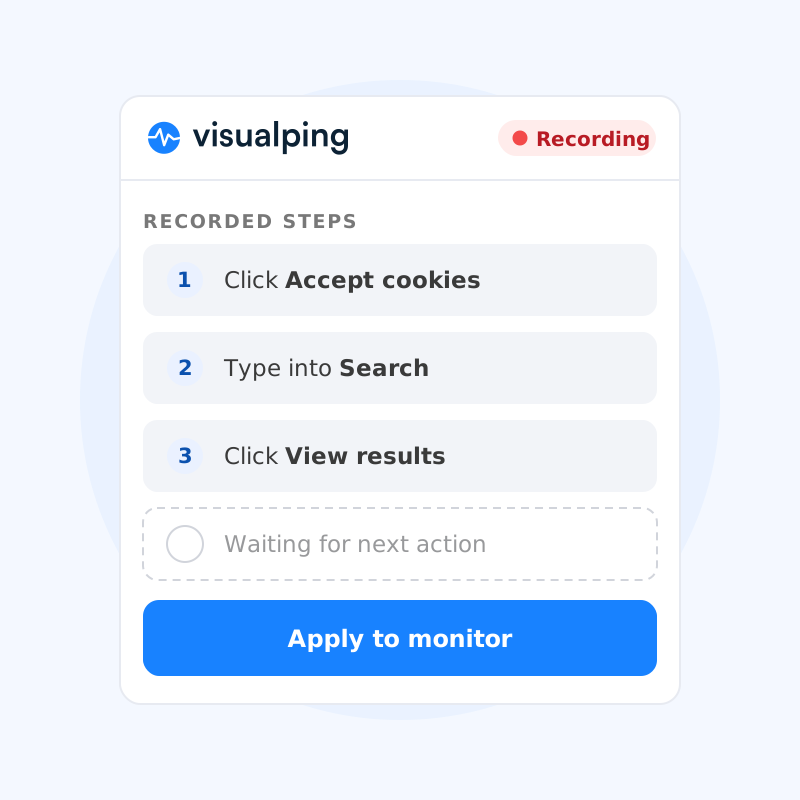
Record your actions, we'll do the rest
Adding actions to a monitor is easier than ever. With the Chrome Extension installed, just browse the page the way you always do and Visualping captures each step, ready to replay on every check. The manual action editor is still there when you want finer control.
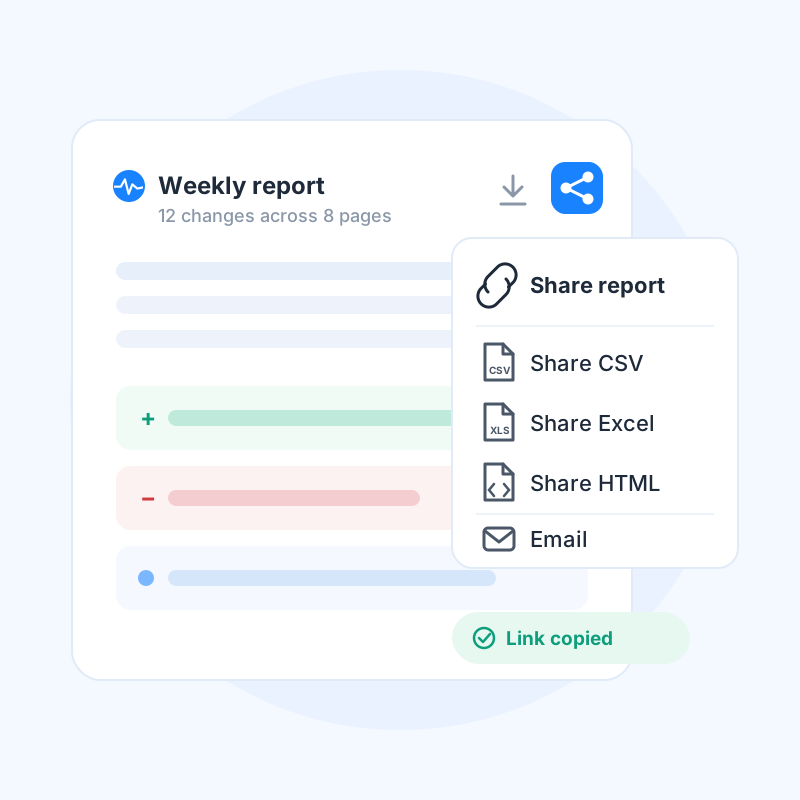
Share your reports in seconds
Getting results in front of your team and stakeholders is now easier than ever. Use the new Share menu in your reports view to copy a direct link, send it by email, or share a CSV, Excel, or HTML version, all in a couple of clicks.
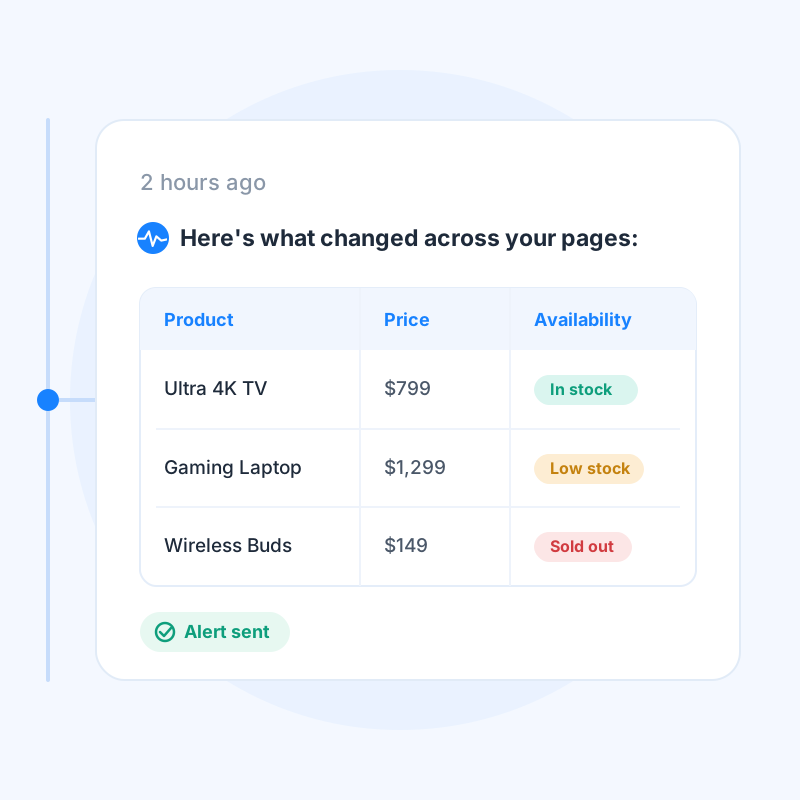
Get change summaries in exactly the format you want
You can tell Visualping how to present detected changes. Just add a format instruction to your prompt, like "Present the changes in a table with three columns: Product, Price, and Availability."
Visualping structures every summary that way, so results land ready to scan, share, or act on.
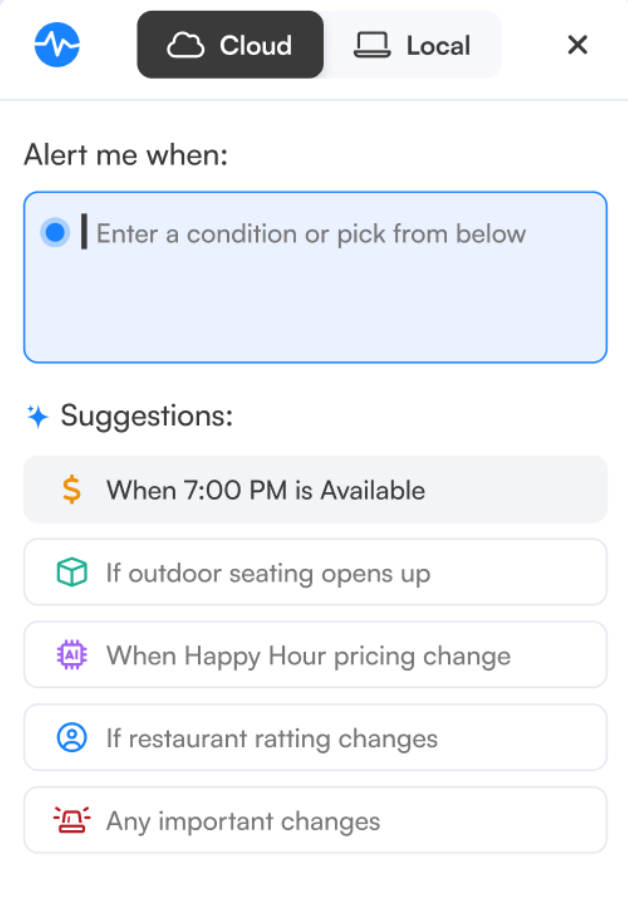
Introducing the Visualping Chrome Extension
The Visualping Chrome Extension lets you set up change alerts without leaving the page you're on. Just click the extension, choose how often you want checks to run, and tell Visualping what to watch. It's a quick way to keep an eye on updates without opening another tab.
Schedule multiple reports for your whole workspace
You can now set up multiple scheduled reports in a single workspace, each with its own schedule and monitors. Send a weekly digest to one team and a daily summary to another, all from the same place.
Connect Visualping to your favorite AI assistant
You can now plug Visualping into any MCP-compatible tool with our custom connector. Set up monitors, check recent changes, and pull results just by asking, in Claude, Cursor, Copilot, and more.
Add the connector once and your monitoring lives right alongside your everyday AI workflow.
Manage your monitors right inside ChatGPT
The Visualping app for ChatGPT just got a major upgrade with full MCP support. Create and manage monitors in plain English, trigger instant checks, and review exactly what changed and when, all without leaving the chat.
No code required; just real web intelligence through the AI you already use.

Send alerts directly to Telegram
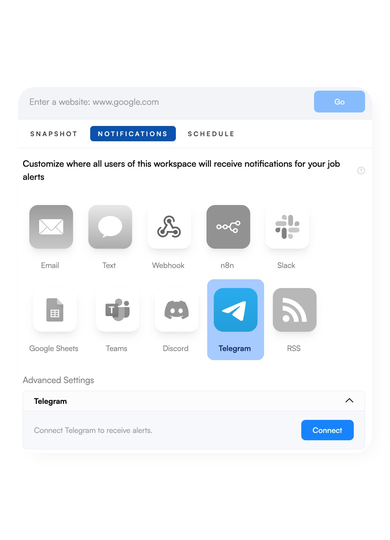
You can now connect a Telegram bot to receive notifications right in your chats and channels. It only takes a minute to set up using your bot token.
Filter and run reports by monitor labels for faster organization
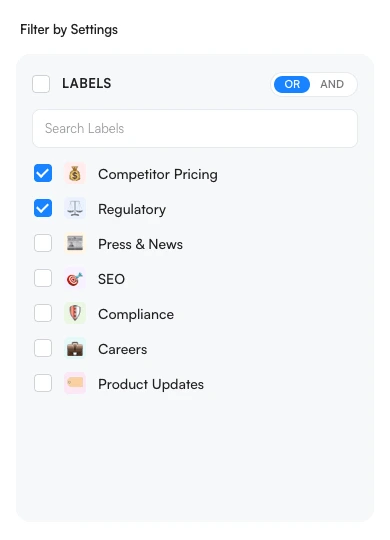
You can now filter reports using your monitor labels, making it easier to slice data by region, project, or any grouping you've set up. Run a report on just the monitors that matter to you, without the noise.
Labels you've already applied to your monitors will carry over automatically.
Sign in faster with Google SSO
Visualping now supports Google Single Sign-On, so you can log in or create an account instantly using your existing Google credentials. Just click "Continue with Google" and you're up and running in seconds.
Email and password login is still available if you prefer.
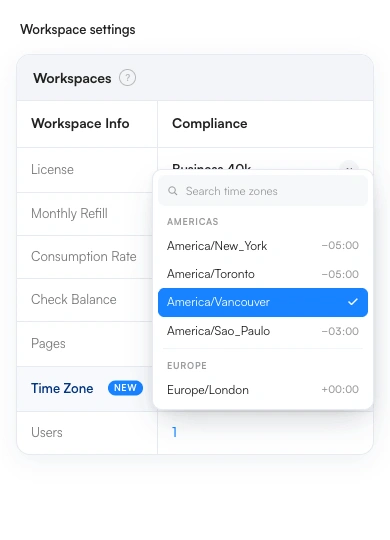
Take full control of your schedule with workspace-level timezones
Business users can now set a timezone at the workspace level, so every monitor schedule and report delivery aligns with your team's preferred time.
Find the setting in the admin menu under Workspaces.
Filter monitors more precisely with AND / OR label logic
Labels now support both AND and OR filtering, giving you more control over how you slice your monitors and changes. Combine labels your way to better organize your workflow and surface exactly what you need, faster.
Find the right job settings faster with our updated help articles
We've refreshed our support documentation to make it easier to fine-tune your monitoring jobs and cut down on false alerts. The updated articles walk you through key settings with clearer guidance and practical tips.
Head to the Help Center to explore the updates.
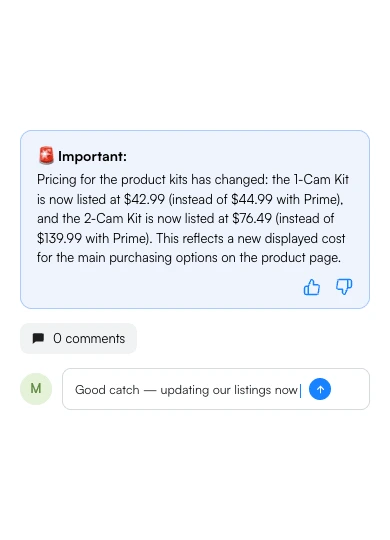
Comment directly on changes to keep your team in sync
Collaboration in Visualping just got easier. You can now leave comments inside any report or change view to flag actions, assign next steps, or drop reminders for teammates.
No more jumping to email or Slack to discuss a change — the conversation lives right where the change does.
Get a digest of every change that matters, delivered to your inbox.
Reports now summarizes your monitored pages into a scheduled digest with AI-powered insights. Instead of checking changes one by one, get a clear overview of what shifted across all your tracked URLs, on a schedule that works for you.

The Visualping API is now available to all users
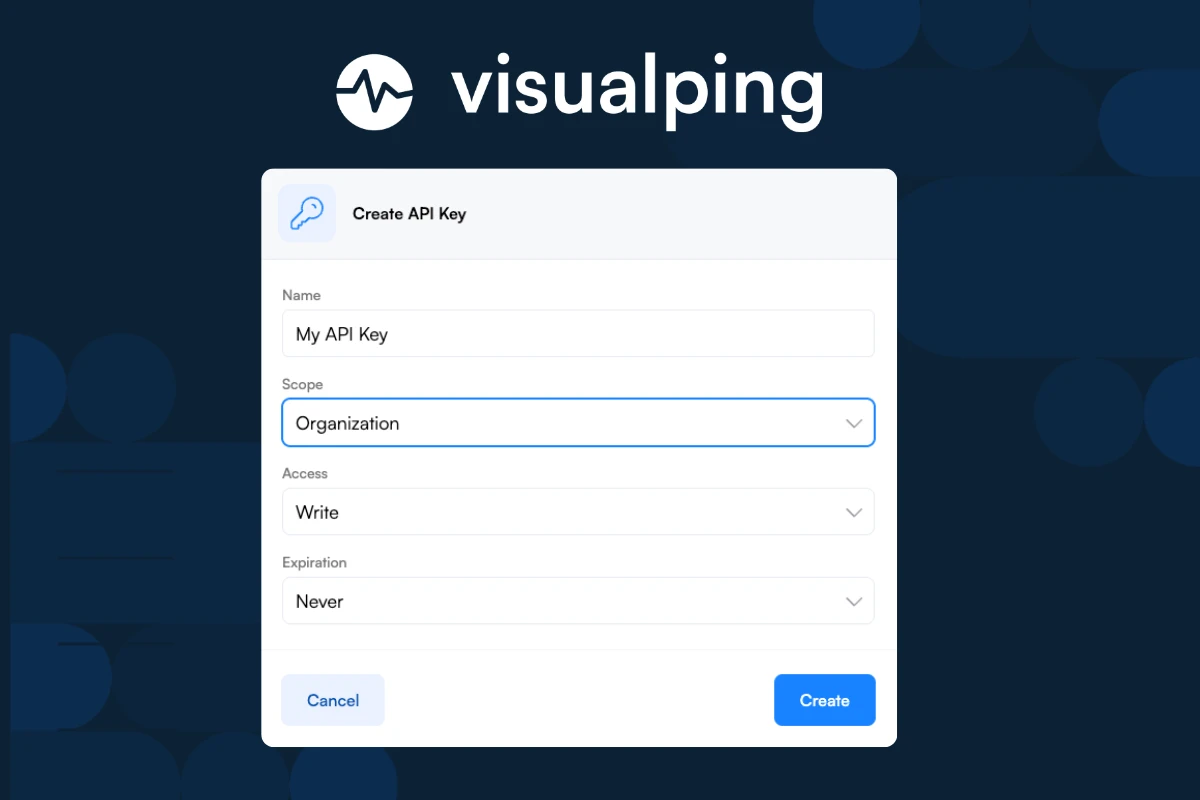
Create, view, and edit alerts in bulk with the Visualping API. Set up hundreds of monitors, configure custom alert rules, and route changes to wherever your team works. Not a developer? AI coding tools like Claude Code can write the scripts for you. Find it in Account Settings → Developer.
Saved Settings: Save your job settings and apply them anywhere in one click
You can now save any combination of actions, labels, and notification channels as a reusable preset. Apply it to new or existing jobs instantly, or set one as your workspace default so it gets added automatically whenever a new job is created.
New Timeline: Check Your Monitor History at a Glance
Reviewing your monitor's change history just got faster. The redesigned timeline gives you a clearer, quicker view of past detections so you can spot what changed and when, without the clutter.
Prefer the previous experience? Just click the Old Timeline button to switch back anytime.
Introducing API Keys: Connect Visualping to Your External Tools
You no longer need to contact support for an API key. Create one yourself from the Account Settings, set the scope and permissions, and connect Visualping to your AI agents, automation platforms, and external tools in minutes.