How to Build Your Own Exclusive Data Feeds for Investing — No Coding Required
By Emily Fenton
Updated November 20, 2024

How to Build Your Own Exclusive Data Feeds for Investing — No Coding Required
The Need for the Right Web Data
For an investment professional, finding the right data is pivotal to developing their investment hypothesis and executing their project. But it’s often a challenge getting their hands on data that fits the bill.
Because so many investment hypotheses and projects are grounded in niche, specific subject matter, the data required is just as niche and specific. Many pre-built datasets, purchased by third-party data providers, do not fit this criteria.
And while your investment research process likely includes staples like Bloomberg, AlphaSense and MorningStar, integrating additional tools, like Bloomberg terminal alternatives into your process can help you scrape web data from the source, so you catch market-moving signals before they hit these services.
In addition, while it’s commonplace for investment professionals to rely on developers at their firm to build custom web scrapers, the process of coordinating across departments every time an investor wants a web source tracked for updates is time-consuming and arduous.
Visualping makes finding the right data, on-demand, easier. Used by over half of the world’s top hedge funds, Visualping is a website change monitoring tool that can track any web source online for web data updates, and streamline those changes into your Google Sheets – effectively allowing you to build your own custom data feeds – without coding.
Custom-Built Web Scrapers
Inefficient
When gathering the data they need to further their investment hypothesis, it’s commonplace for investment professionals to rely on custom built web scrapers from the software developers at their firm.
With a custom built scraper, the developer can automatically collect data from selected web sources online, for the exact data they’re after. That way, the data is relevant and specific to the project at hand. Such sources include news websites, financial news platforms, social media, regulatory filings, and industry-specific forums.
However, relying on custom built scrapers come with their own issues. For one, the investment professional has to rely on another department to build their scrapers for them, before they can start collecting the data they need. This takes time, coordinating across departments and working with an engineer to communicate the project requirements.
It also takes time and resources, investigating whether that data is accurate, specific and truly relevant to the investment project. On the surface, the dataset may appear to be suitable but, after purchasing it and analyzing it further, it’s anything but.
Ineffective
The scrapers are also not always effective. Scrapers can get blocked, miss important updates, or check the web page too infrequently, preventing the investment professional from staying on top of web data changes promptly, and potentially taking advantage of events-driven investment opportunities.
Why Web Monitoring Tools are Handy for Events-Driven Investing
Automatic Monitoring – without the coding
Gathering data for investment management and generating alpha involves detailed research and analysis. Every investment professional needs to know about web data changes, from a variety of different web sources online.
Just like custom built scrapers, website change monitoring tools allow you to gather the data you need for your project, but without the need for code.
This is because these website change detection tools are available online, and are designed to be easy-to-use for people who have no coding experience.
Visualping is the simplest to use amongst competing website change monitoring tools. The methodology is simple: just copy and paste the URL you want automatically checked for changes, and the tool will check it for you at your preset frequency, and notify you when there’s a change.
Instead of relying on a developer to build a scraper for you, monitor the pages you need for data on your own.
Google Sheets Integrations
Some website change monitoring tools have integrations with Google Sheets, like Visualping. When a change is detected, the tool will automatically report the change in your selected Google Sheets, effectively building your own exclusive dataset.
Versatility in what you can track
Many custom built scrapers are built for specific web pages of interest. If the investment professional wants to track another, different page, they have to request a new scraper be built for that page.
Web monitoring tools, on the other hand, are versatile. They allow you to get notified on information that can be as niche and specific as you want, allowing the investor to make better investment decisions because they’re getting notified on the exact data that provides the insights they need to generate insights.
It’s easy, then, to track web data from a plethora of different sites, as well as get notified on information that’s as niche and specific as you want for your investment project.
Check out our blog post on some of the top web sources to track for better investments.
Example Data Feed Use Cases with Visualping
Here is a brief list of several use case examples you can track with Visualping
1. Price & Stock Patterns
There are many different reasons why a given investor would want to track a company’s pricing and stock patterns. Perhaps to understand the fundamentals of specific companies, investors can use Visualping to track their pricing and stock changes over time. Analysts and portfolio managers often tend to use Visualping as a price tracker.
Pricing and stock patterns can help you estimate the sales volume of certain products, and estimate whether the eCommerce retailer will meet their quarterly targets. As well as getting a sense of corporate performance, you can gauge consumer trends over time, too.
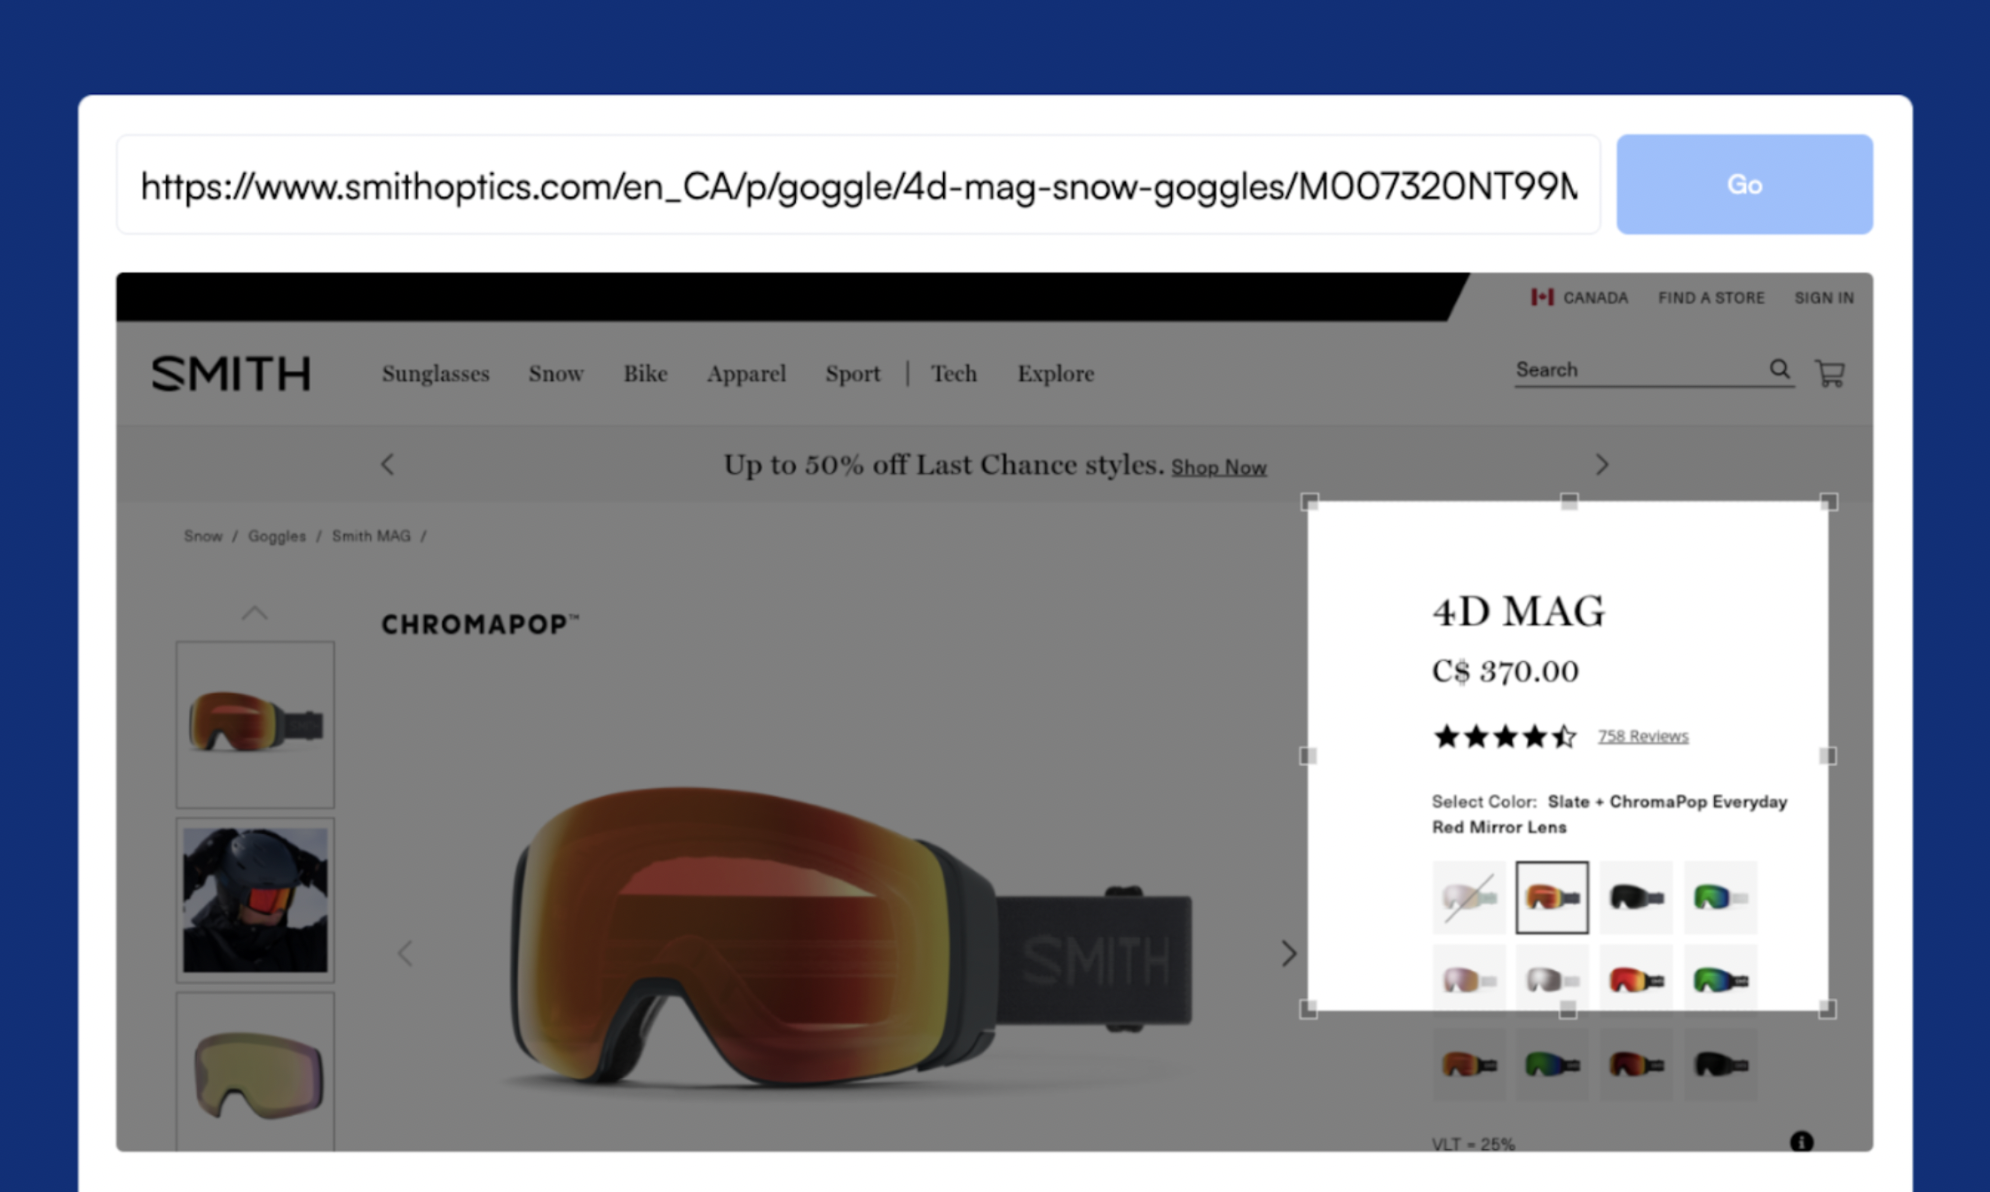
Track pricing and stock updates from any eCommerce product page for insights about corporate performance, and consumer and market trends.
2. Consensus & Analyst Pages
Hedge funds often use Visualping to collect data from specific companies’ consensus and analyst pages. You can automatically compile the updates into a structured format, such as in Google Sheets, with Visualping’s Google Sheets integration. This allows you to more easily assess a company’s performance overtime – and even compare it to competitors.
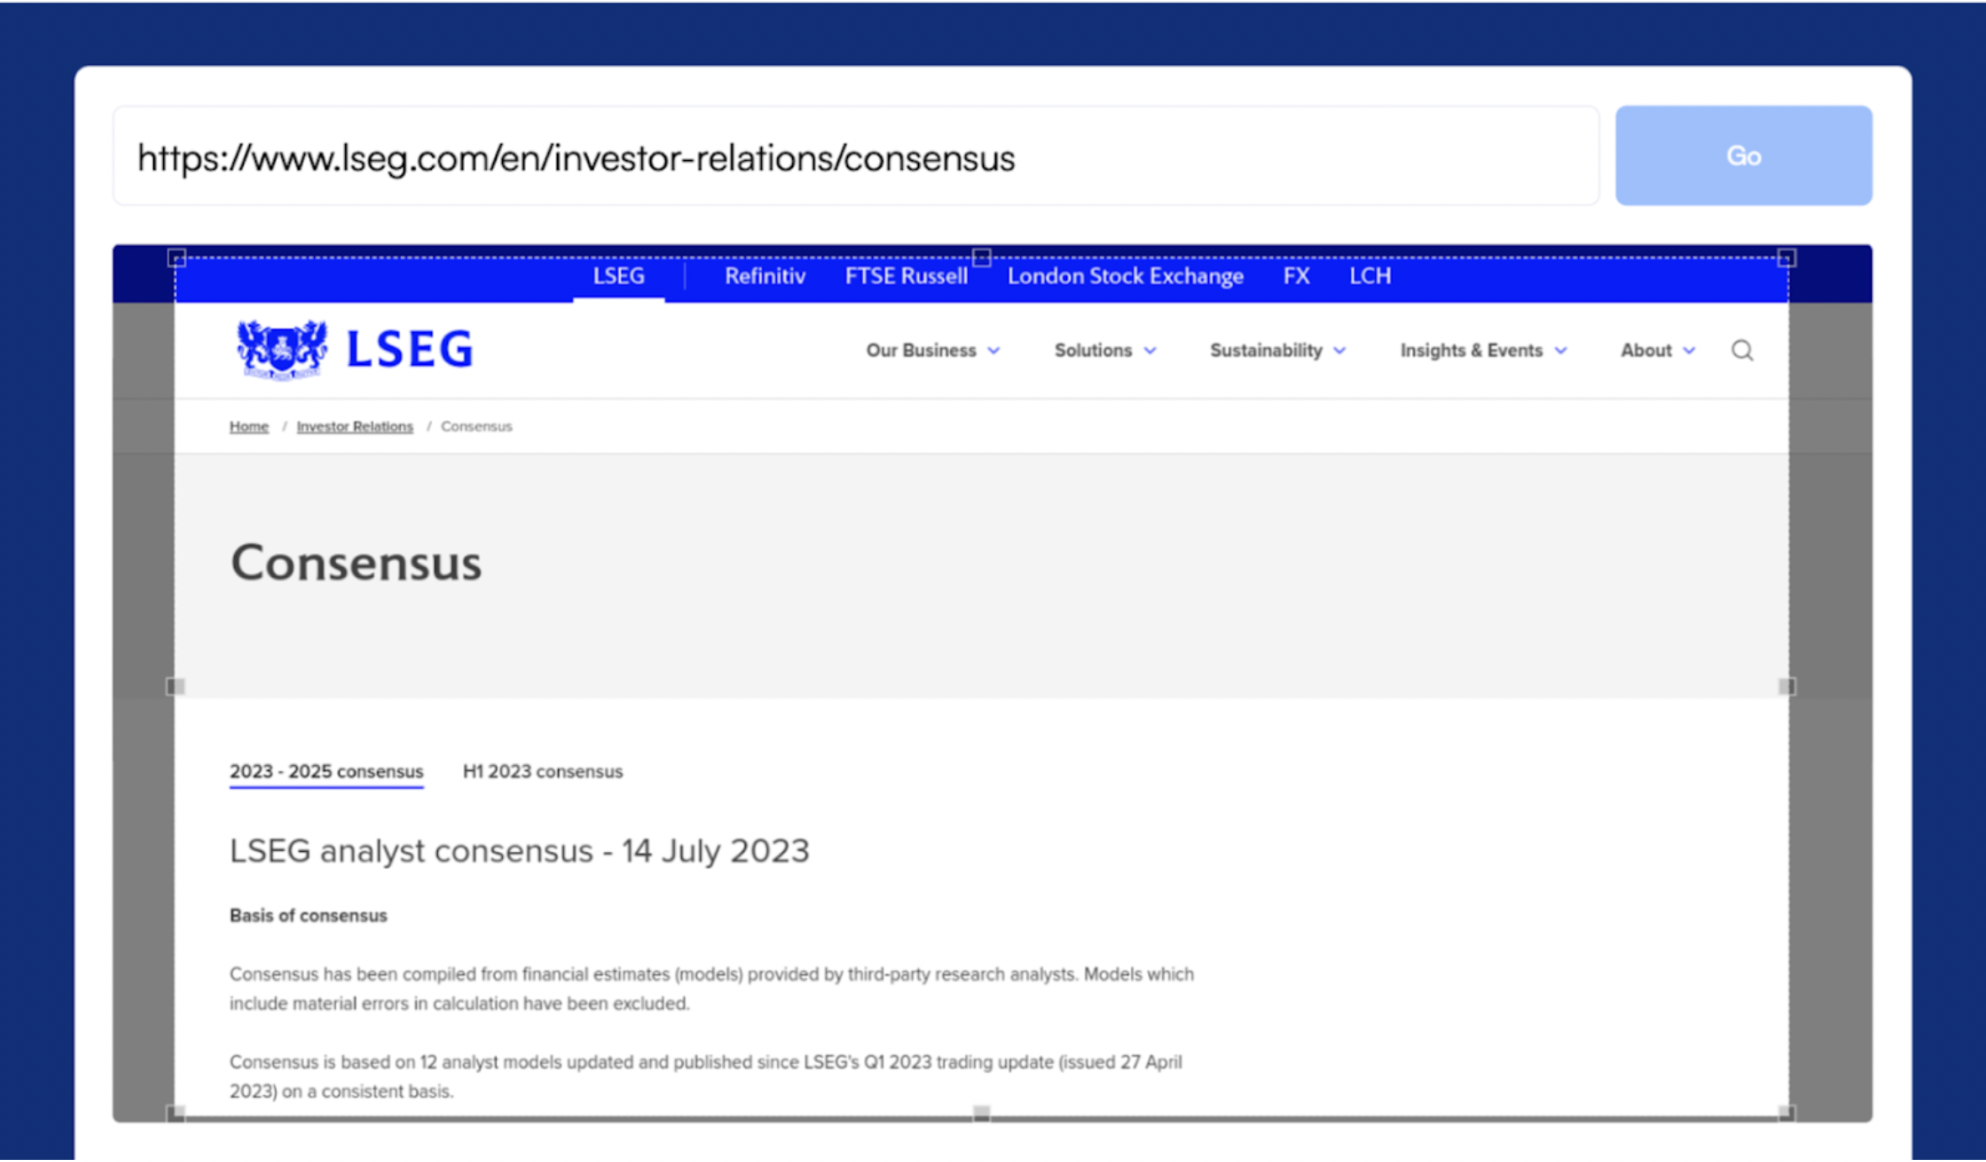
Monitor consensus and analyst pages to keep an eye on the fundamentals of your specific portfolio companies, or potential investment projects.
3. Geographic Presence
New markets are a sign of growth. Understanding whether or not a company is expanding, the extent to which a company is expanding, and where can tell you a lot about how a company is doing, and the potential for future plans. Visualping has both a textual and visual monitoring option, the latter of which lets you capture web page pixels, making monitoring maps, images and visual changes easy. Correlate changes in geographical presence to changes in the value of a stock.
4. News and Press Releases
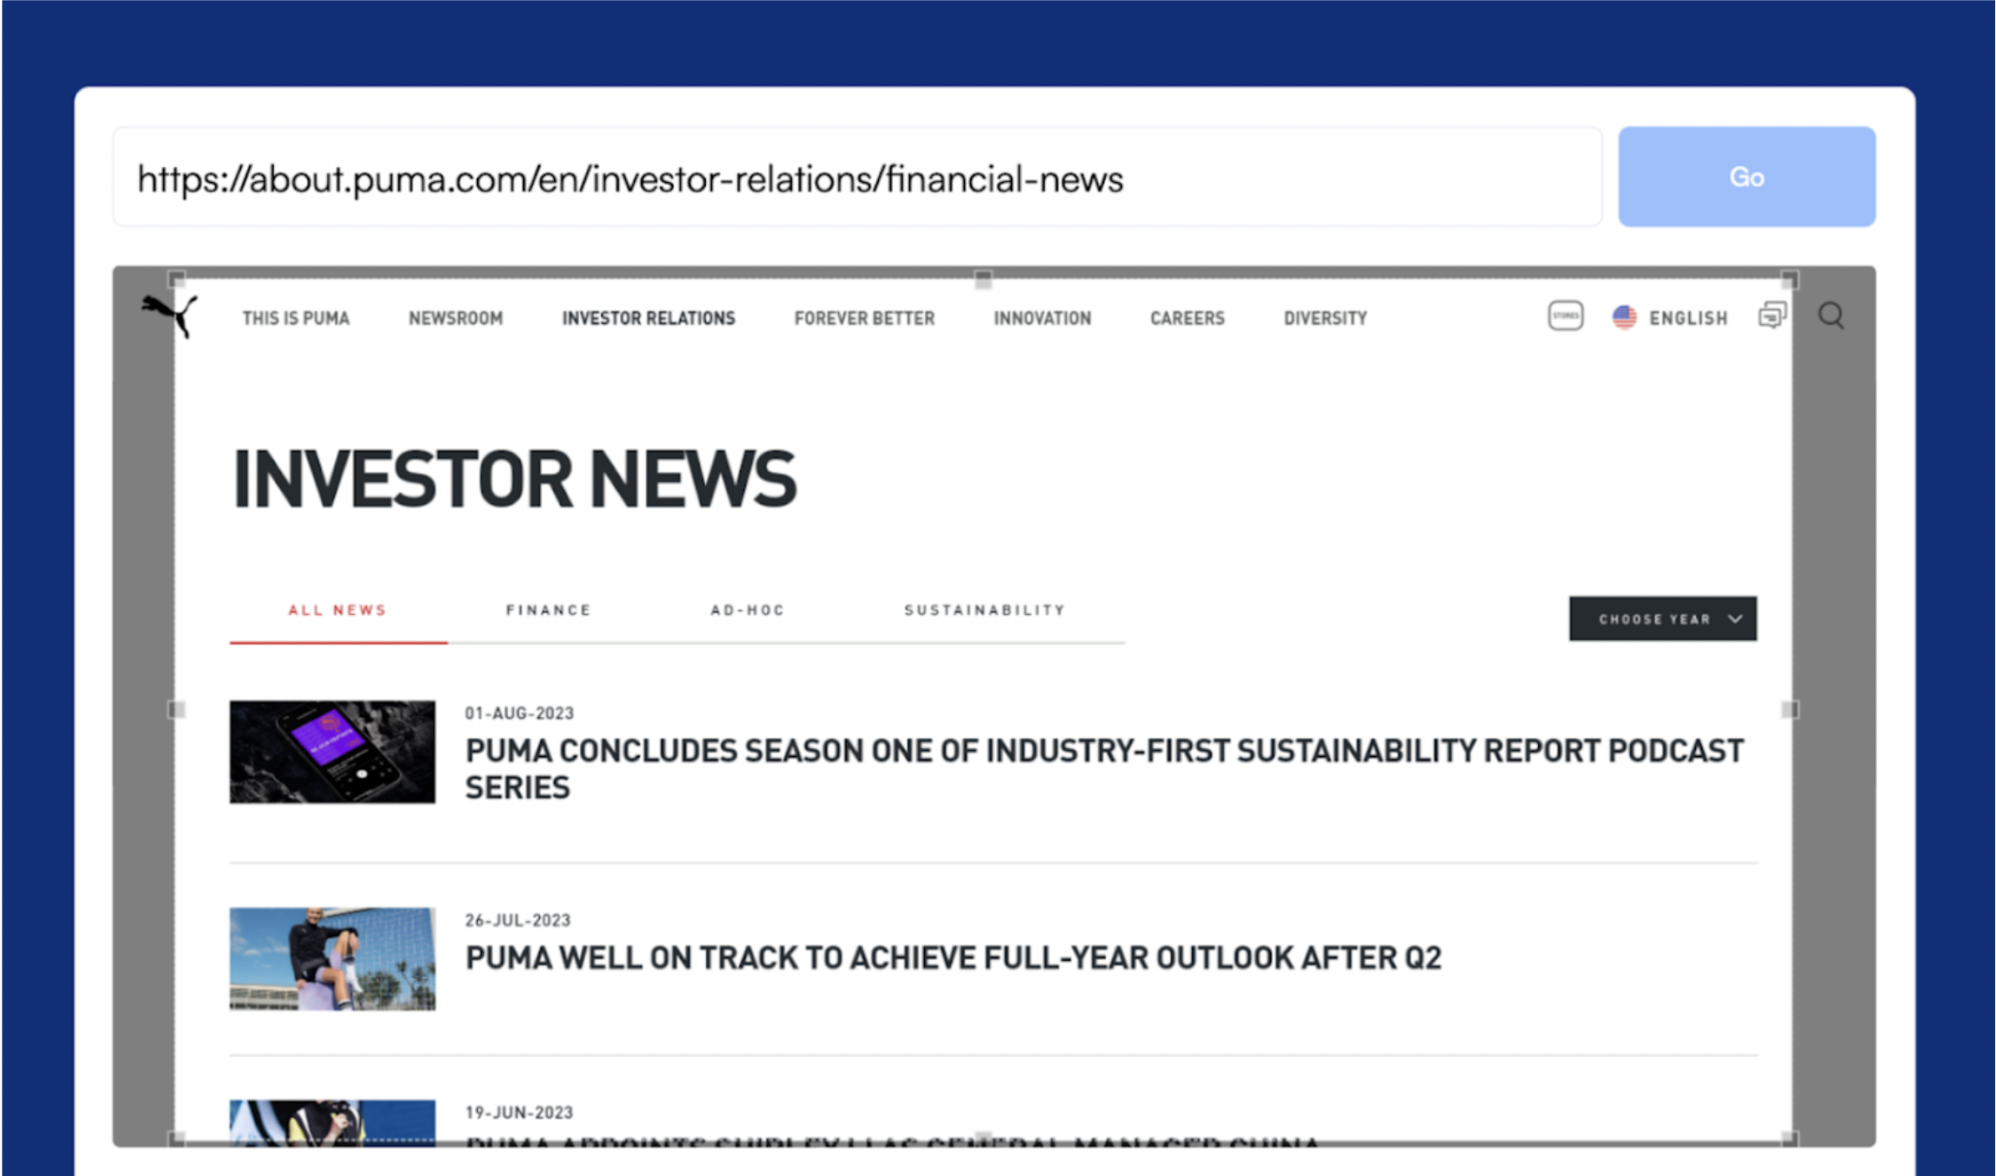
Get relevant news alerts as soon as they’re published.
Perhaps for general information gathering and gauging market trends, tracking your favorite financial news outlets is a great way to stay on top of the latest headlines and get a sense of market trends more generally. Use Visualping’s keyword alerts feature to only get notified of certain keywords and phrases, for tailored news alerts on the exact topics you’re interested in.
How to Build Your Own Data Feeds with Visualping
Step-By-Step Tutorial
Investment professionals can elevate their pipeline with Visualping.
Visualping automatically monitors any specific sources you want online, and sends you real-time data alerts when there’s a change. Investors can stay on top of developments from a niche source to more easily take advantage of events-driven opportunities.
Here’s how to get setup.
Step 1: Access Visualping’s Homepage and copy and paste any URL in the Search Field
Open your web browser and visit the Visualping homepage. From the web page that contains the web data you want to track, copy the URL from the address bar. Paste this URL into the provided search field on the Visualping homepage to display the viewfinder which allows you to select the specific section you want to track.
Step 2: Select the Section of the Page to be Monitored
Choose the specific area of the webpage that you are interested in monitoring for events-driven investing. You can also utilize advanced settings to receive alerts when specific keywords appear on the page.
Step 3: Determine the Monitoring Frequency
Indicate the frequency at which Visualping should check the page for updates. You can set the interval anywhere between five minutes and one month, depending on your preferences. This enables you to receive notifications at your desired convenience.
Step 4: Provide your Email for Notification Delivery
To receive notifications regarding any changes on the monitored page, you need to provide Visualping with an email address. Input an active email address that you frequently check to ensure timely receipt of each notification.
That’s a Wrap
For an investment professional, finding the right data is key to developing their investment hypothesis and executing their project.
While custom scrapers are slow to implement, interrupt your workflow and even miss important changes, website change monitoring tools can present as a convenient alternative, or a tool to help complement your current web data gathering strategy.
Visualping lets you track any web sources on the web for the data you’re looking for, and automatically streamlines those data updates into your Google Sheets, effectively allowing you to build your own exclusive data feeds.
Don’t hesitate to contact us for more information, or to get started on our 14-day free trial.
Want to uncover leading market signals?
Monitor any web source online, and get notified of market-moving events, with Visualping.
Emily Fenton
Emily is the Product Marketing Manager at Visualping. She has a degree in English Literature and a Masters in Management. When she’s not researching and writing about all things Visualping, she loves exploring new restaurants, playing guitar and petting her cats