Introducing Visualping Reports: One Briefing, Your Schedule
By The Visualping Team
Updated March 5, 2026

TL;DR: Visualping Reports consolidates changes from all your monitoring jobs into one briefing with AI-generated summaries, visual diffs, importance flags, and team annotations. Comment on changes, flag what matters, and hide the noise. Generate on demand or schedule daily/weekly delivery to your entire team. Choose which jobs to include, pick a date range, and hit Generate. Available now, free with all Business plans. Setup takes under 2 minutes.
You set up monitoring to know when things change. But as your watchlist grows (five pages become fifty, fifty become five hundred) the value starts to invert. Instead of saving time, you spend it sifting through a stream of individual alerts, trying to piece together what actually happened, what matters, and what to do about it.
That is alert fatigue, and it is the single biggest obstacle between website change monitoring and intelligence.
Today, we are shipping Visualping Reports to close that gap. Trusted by over 2 million monitoring professionals (including teams at 85% of Fortune 500 companies), Visualping already detects the changes. Reports turns them into intelligence.
Reports consolidates changes detected across your selected monitoring jobs into a single, structured briefing, generated on demand or delivered on a schedule you define. Select the jobs you want to include, pick your date range, and hit Generate. One document. The changes that matter. Context you can act on.
The AI summary: what changed and why it matters
Individual change alerts are necessary. They tell you something happened. But they do not tell you what it means in the context of everything else that happened. That requires synthesis: reviewing alerts side by side, spotting patterns, separating signal from noise. Until now, that work fell on you.
Reports does it automatically.
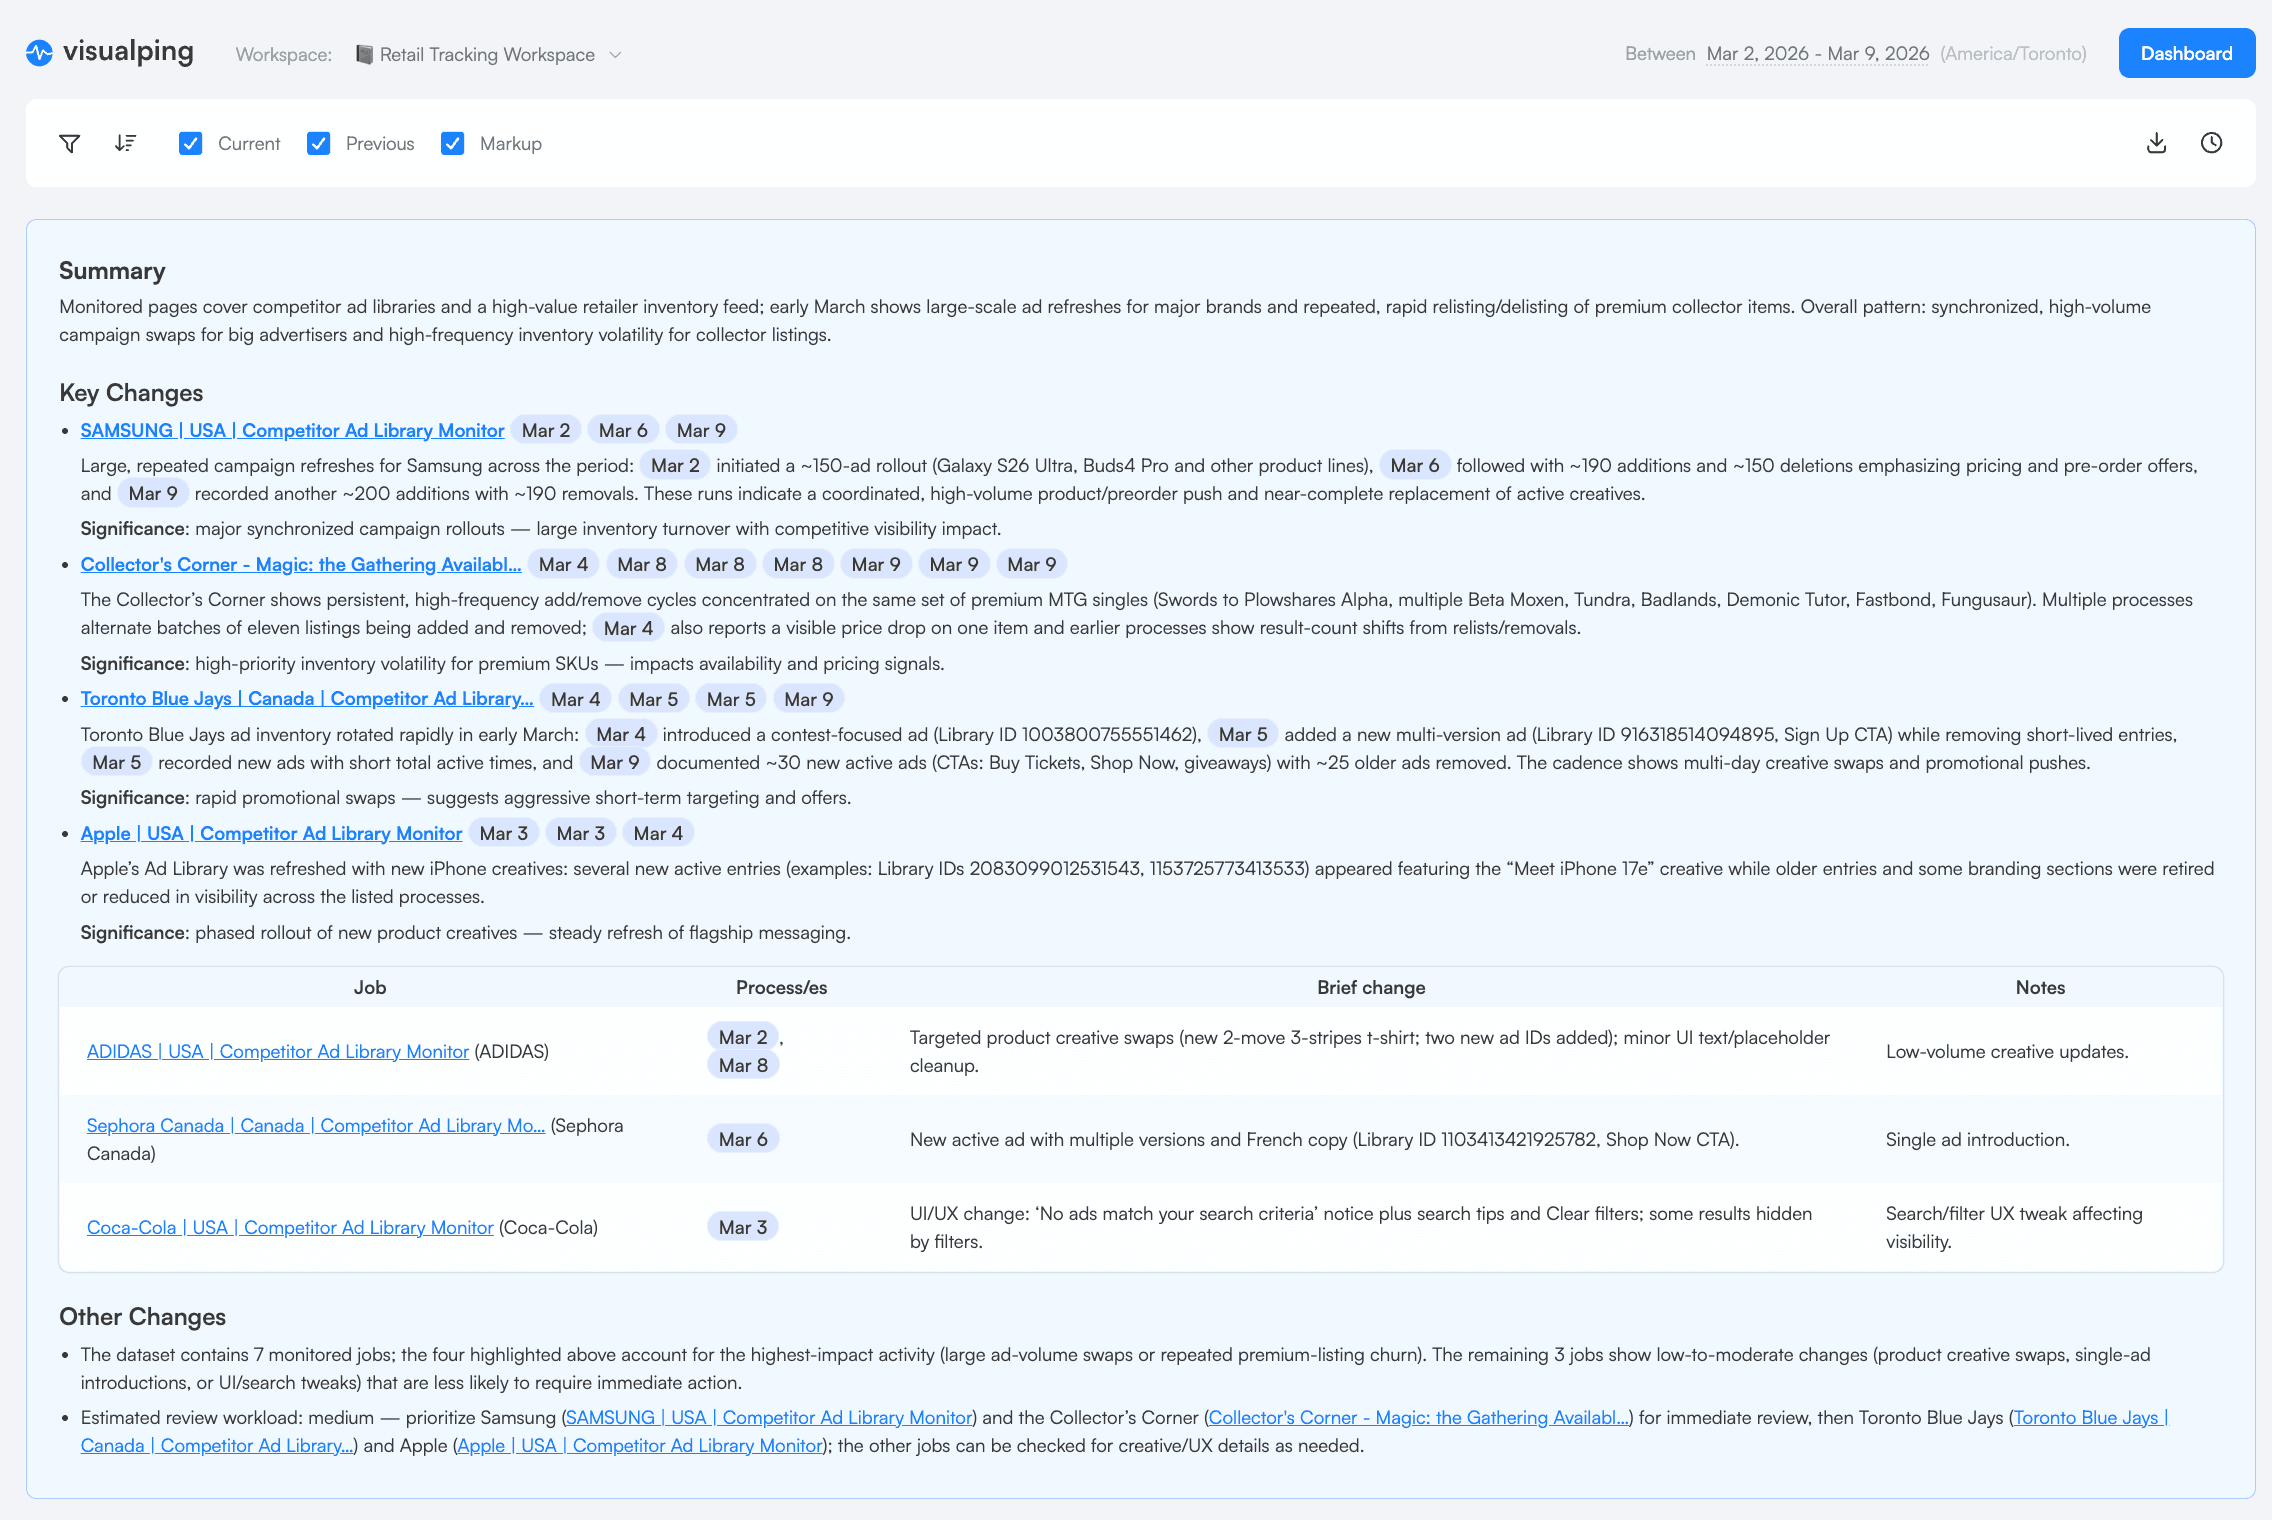
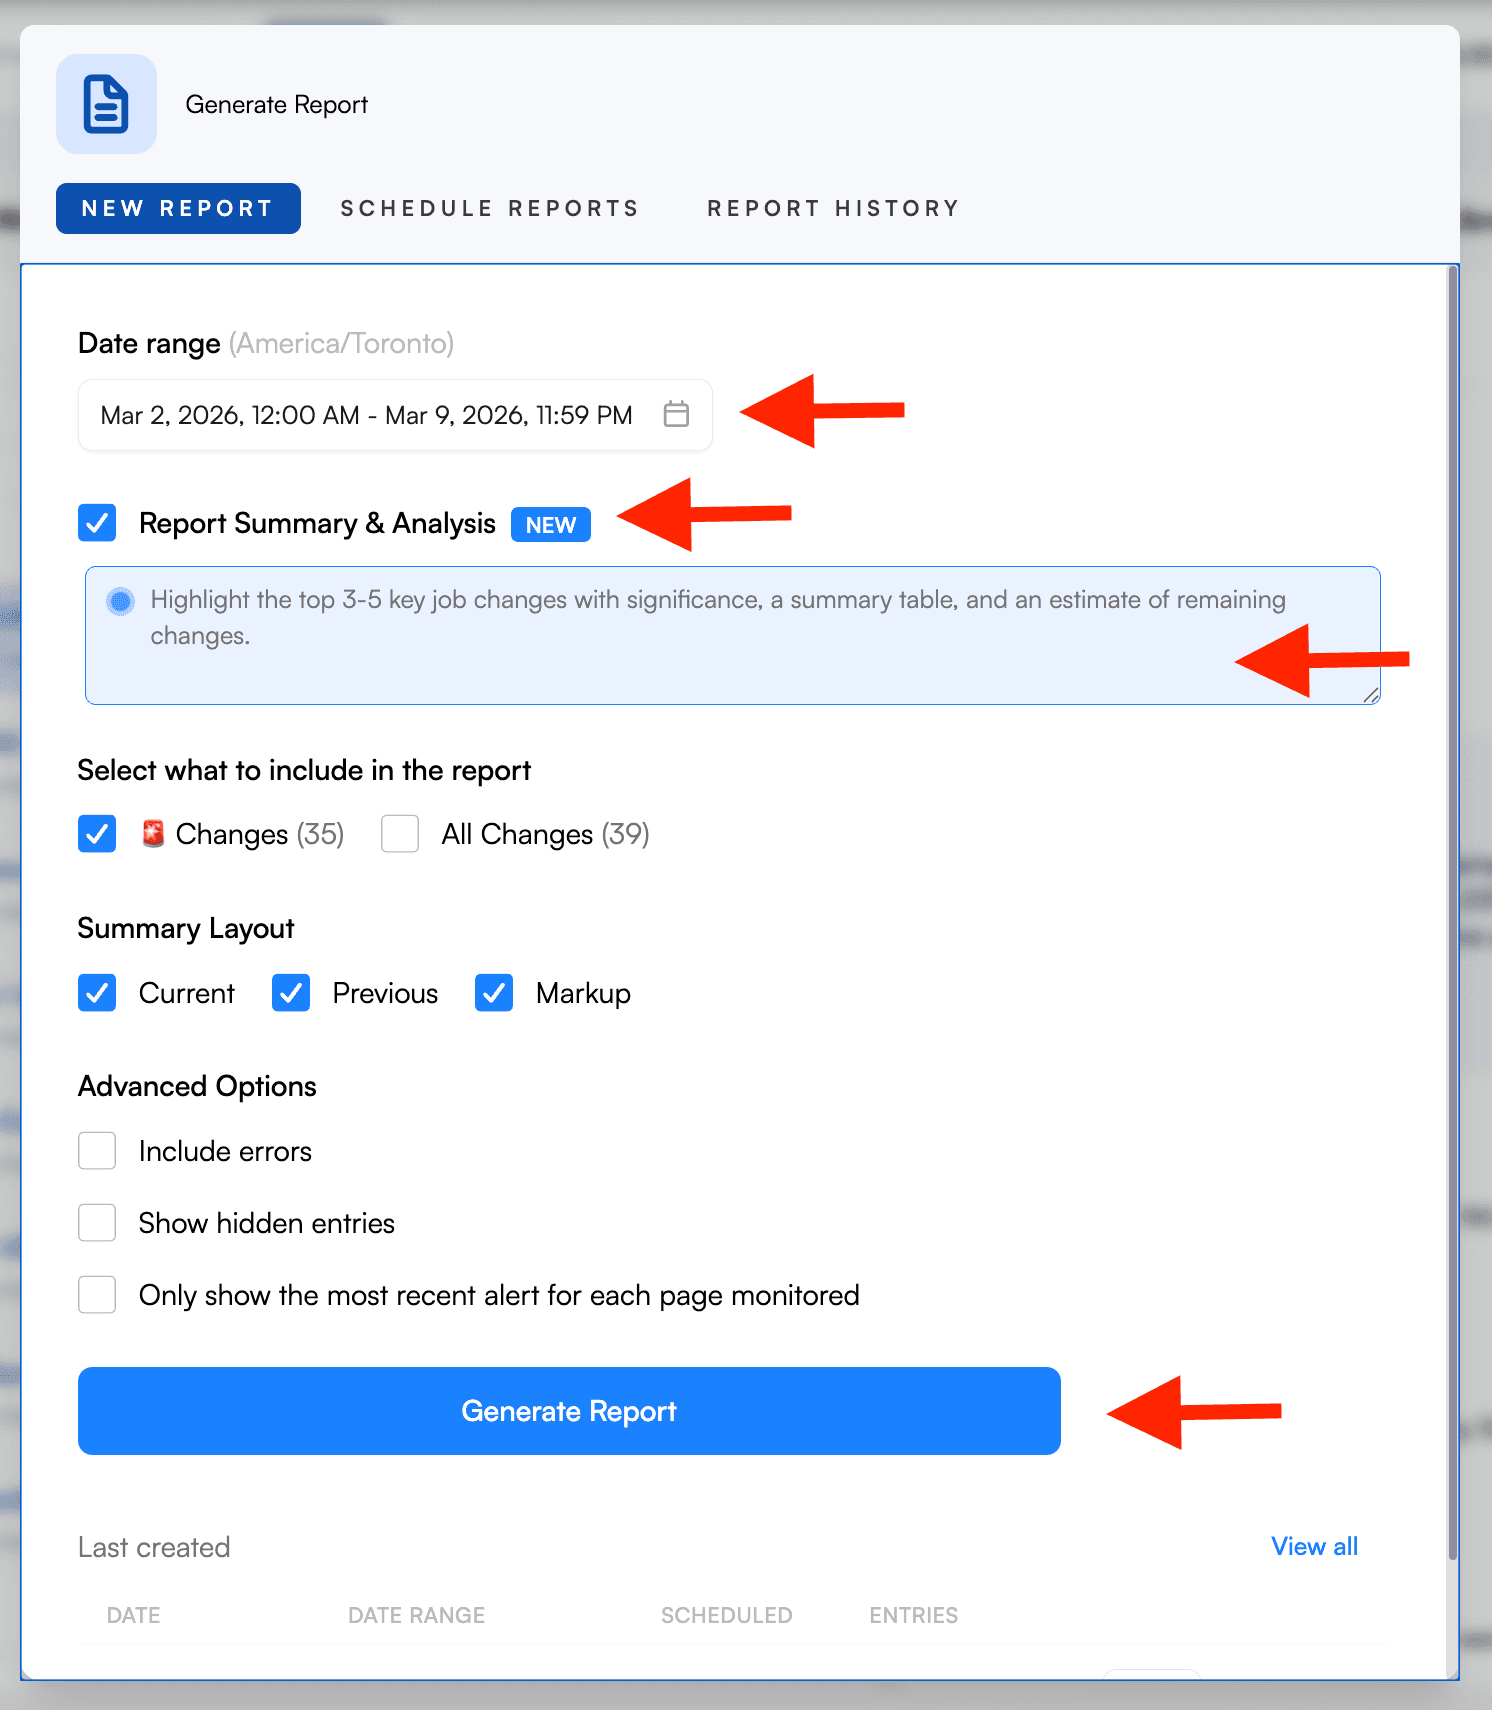
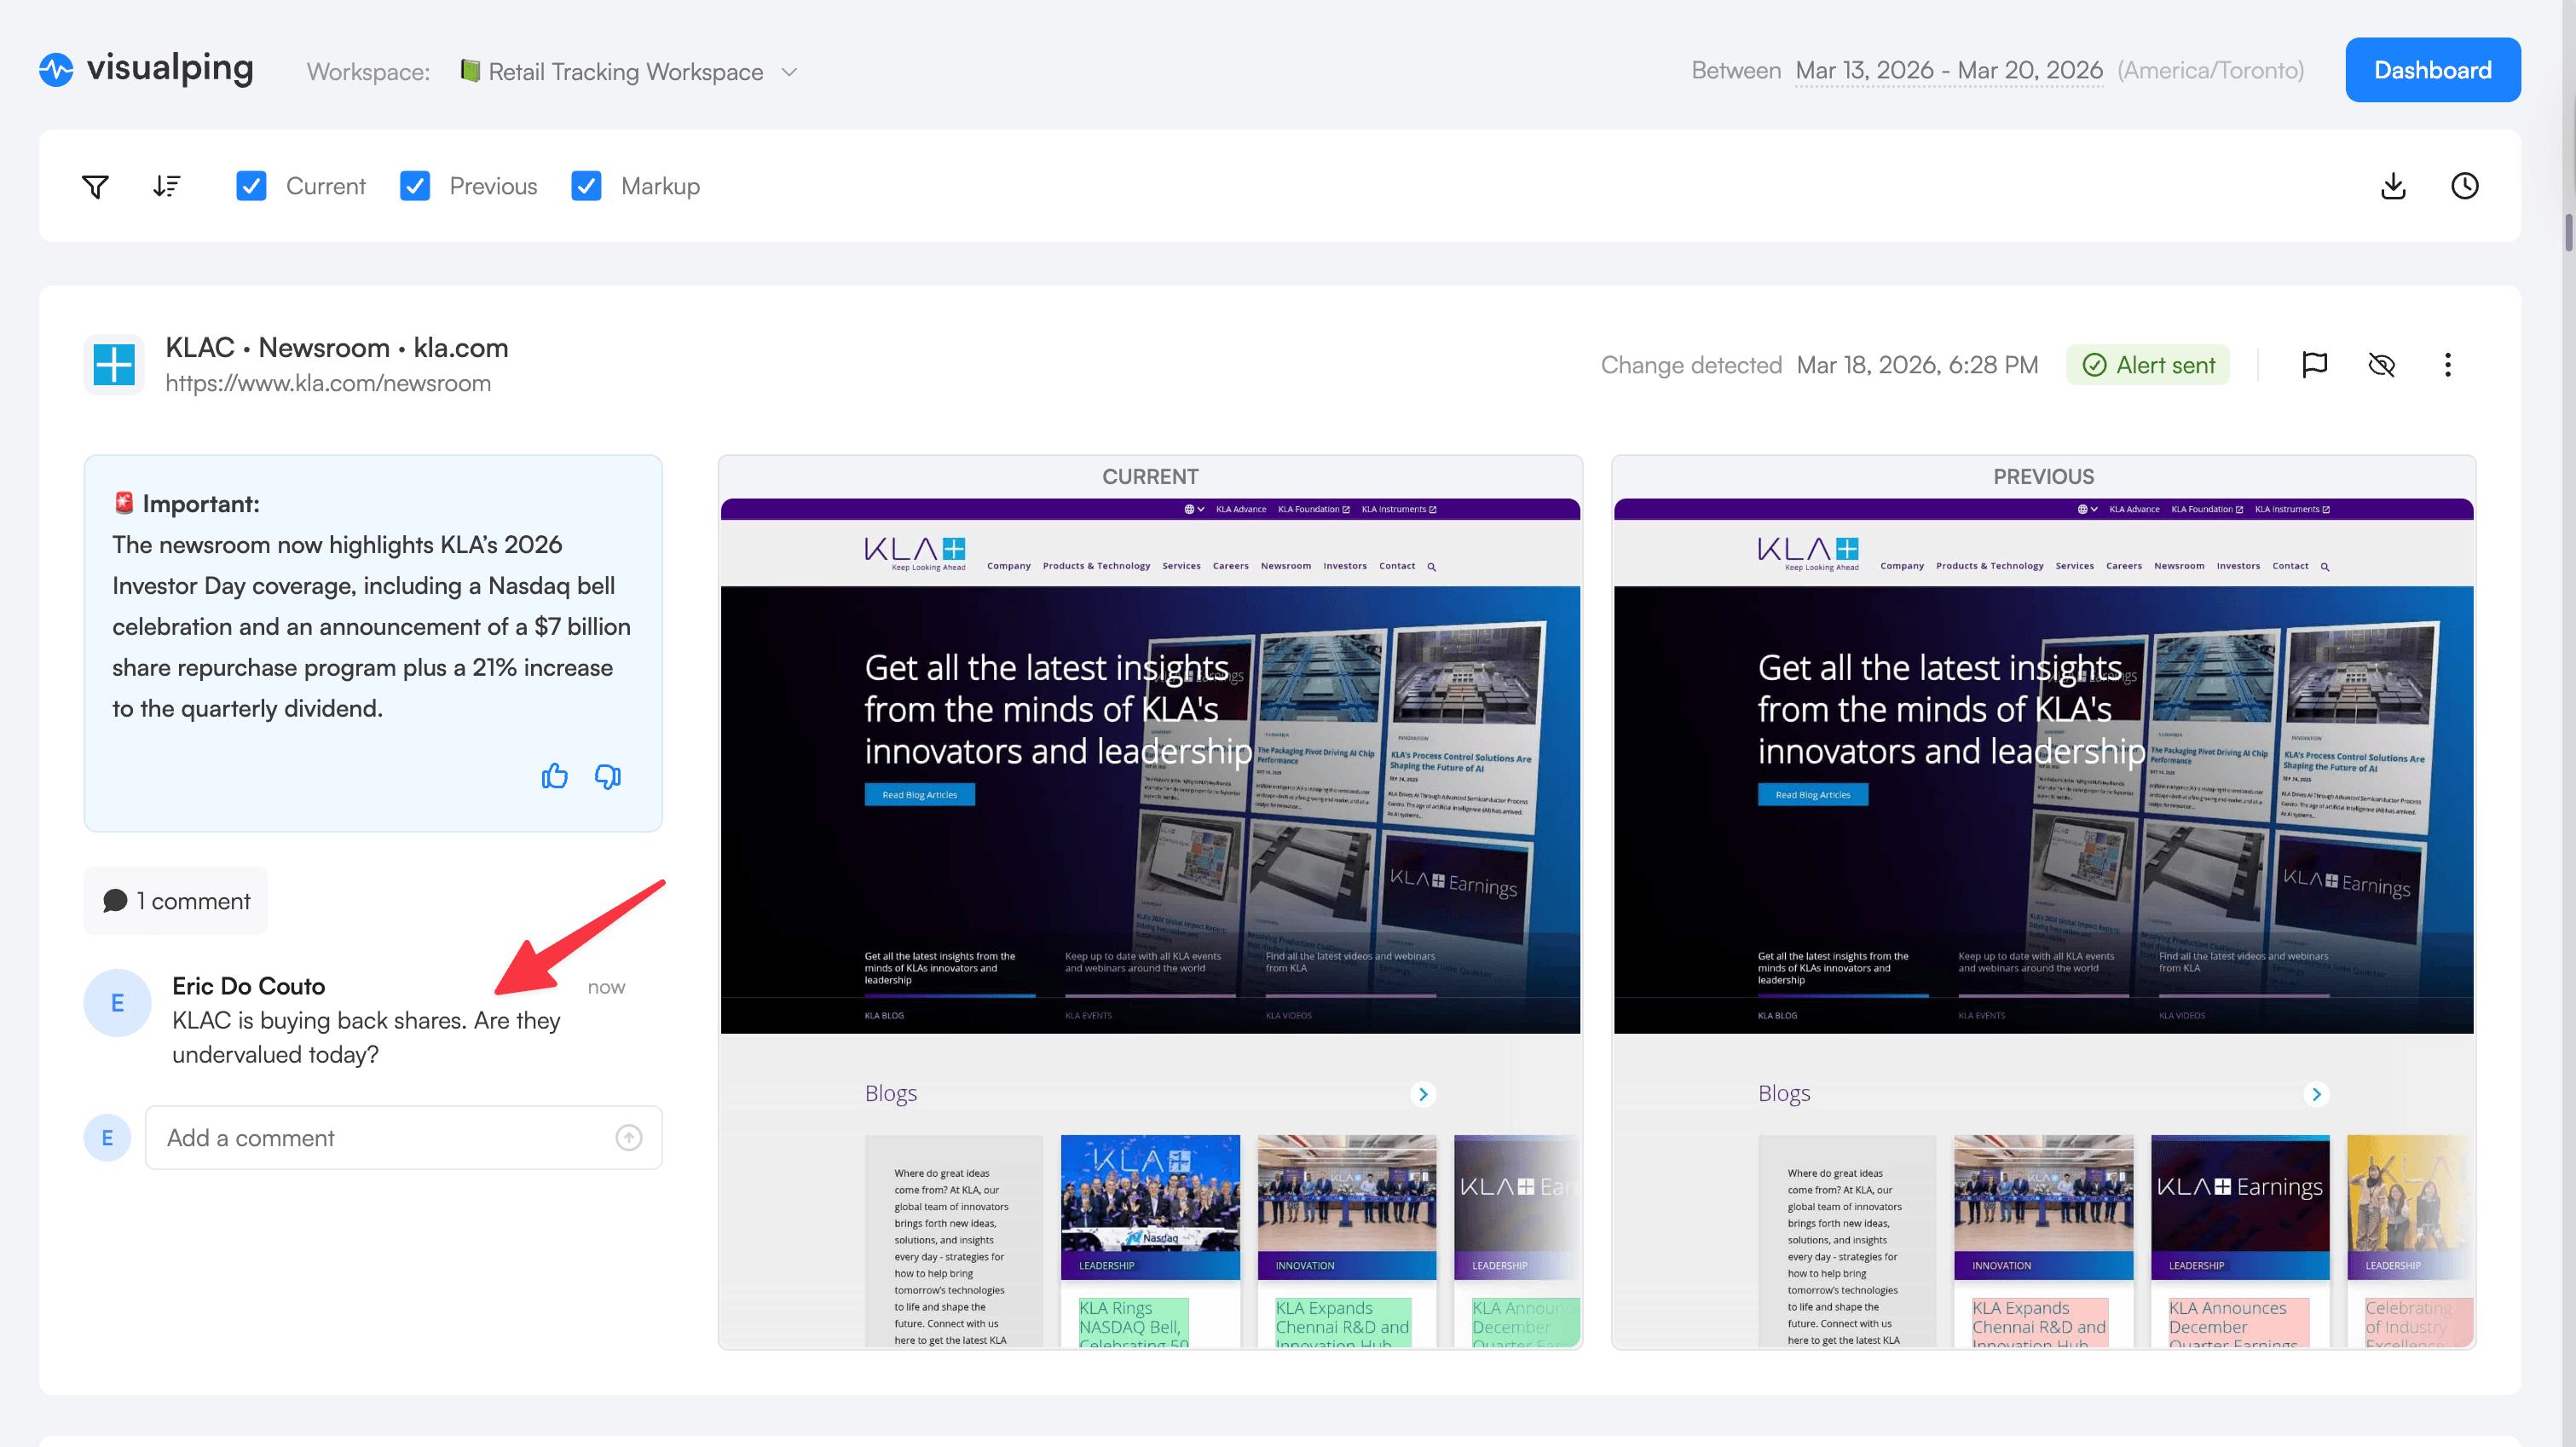
When you generate a report, you select which monitoring jobs to include using the checkboxes in your job list, pick your date range, and toggle on "Report Summary & Analysis." Visualping's AI then analyzes every change captured across your selected jobs and produces a written summary at the top of the briefing. It is pattern recognition: frequency, velocity, competitive behavior, emerging trends. Below the summary, each individual change is documented with its own AI-generated description, importance flag, and side-by-side screenshots showing exactly what changed.
The result is a briefing you can read in minutes, share with your team, or hand to your VP. No Visualping login required.
Try Reports in your workspace now →
What your Monday morning looks like
It's Monday at 9 AM. You open your inbox. Instead of 47 separate change alerts from last week, there's one email: "Weekly Competitive Landscape: Feb 3 - 9."
You click it. At the top, an AI-generated summary tells you that Competitor A updated their pricing page twice, Competitor B launched a new case study with different social proof metrics, and a regulatory page you track changed its guidance language. Below that, each change has its own entry with an importance flag, an AI-written description of what shifted, and side-by-side screenshots showing exactly what's different.
You forward it to your VP with a one-line note. Total time from inbox to action: 4 minutes.
That's Reports.
Build it once, receive it every morning
The first time, you choose what goes into your briefing: select the monitoring jobs you want (checkboxes in your job list), set a date range, choose which changes to include (all of them, or only the ones AI flags as important), toggle on "Report Summary & Analysis" for the AI-generated overview, and pick your preferred screenshot layout (current state, previous state, markup view, or any combination). Hit Generate, and your briefing is ready in moments.
Then set it to repeat. Pick a cadence (daily at 9 AM, weekly on Fridays, whatever matches your rhythm) and Visualping generates and delivers the briefing to every user in your workspace automatically. Same filters, every time. No manual work. No missed windows.
Share it however your team works
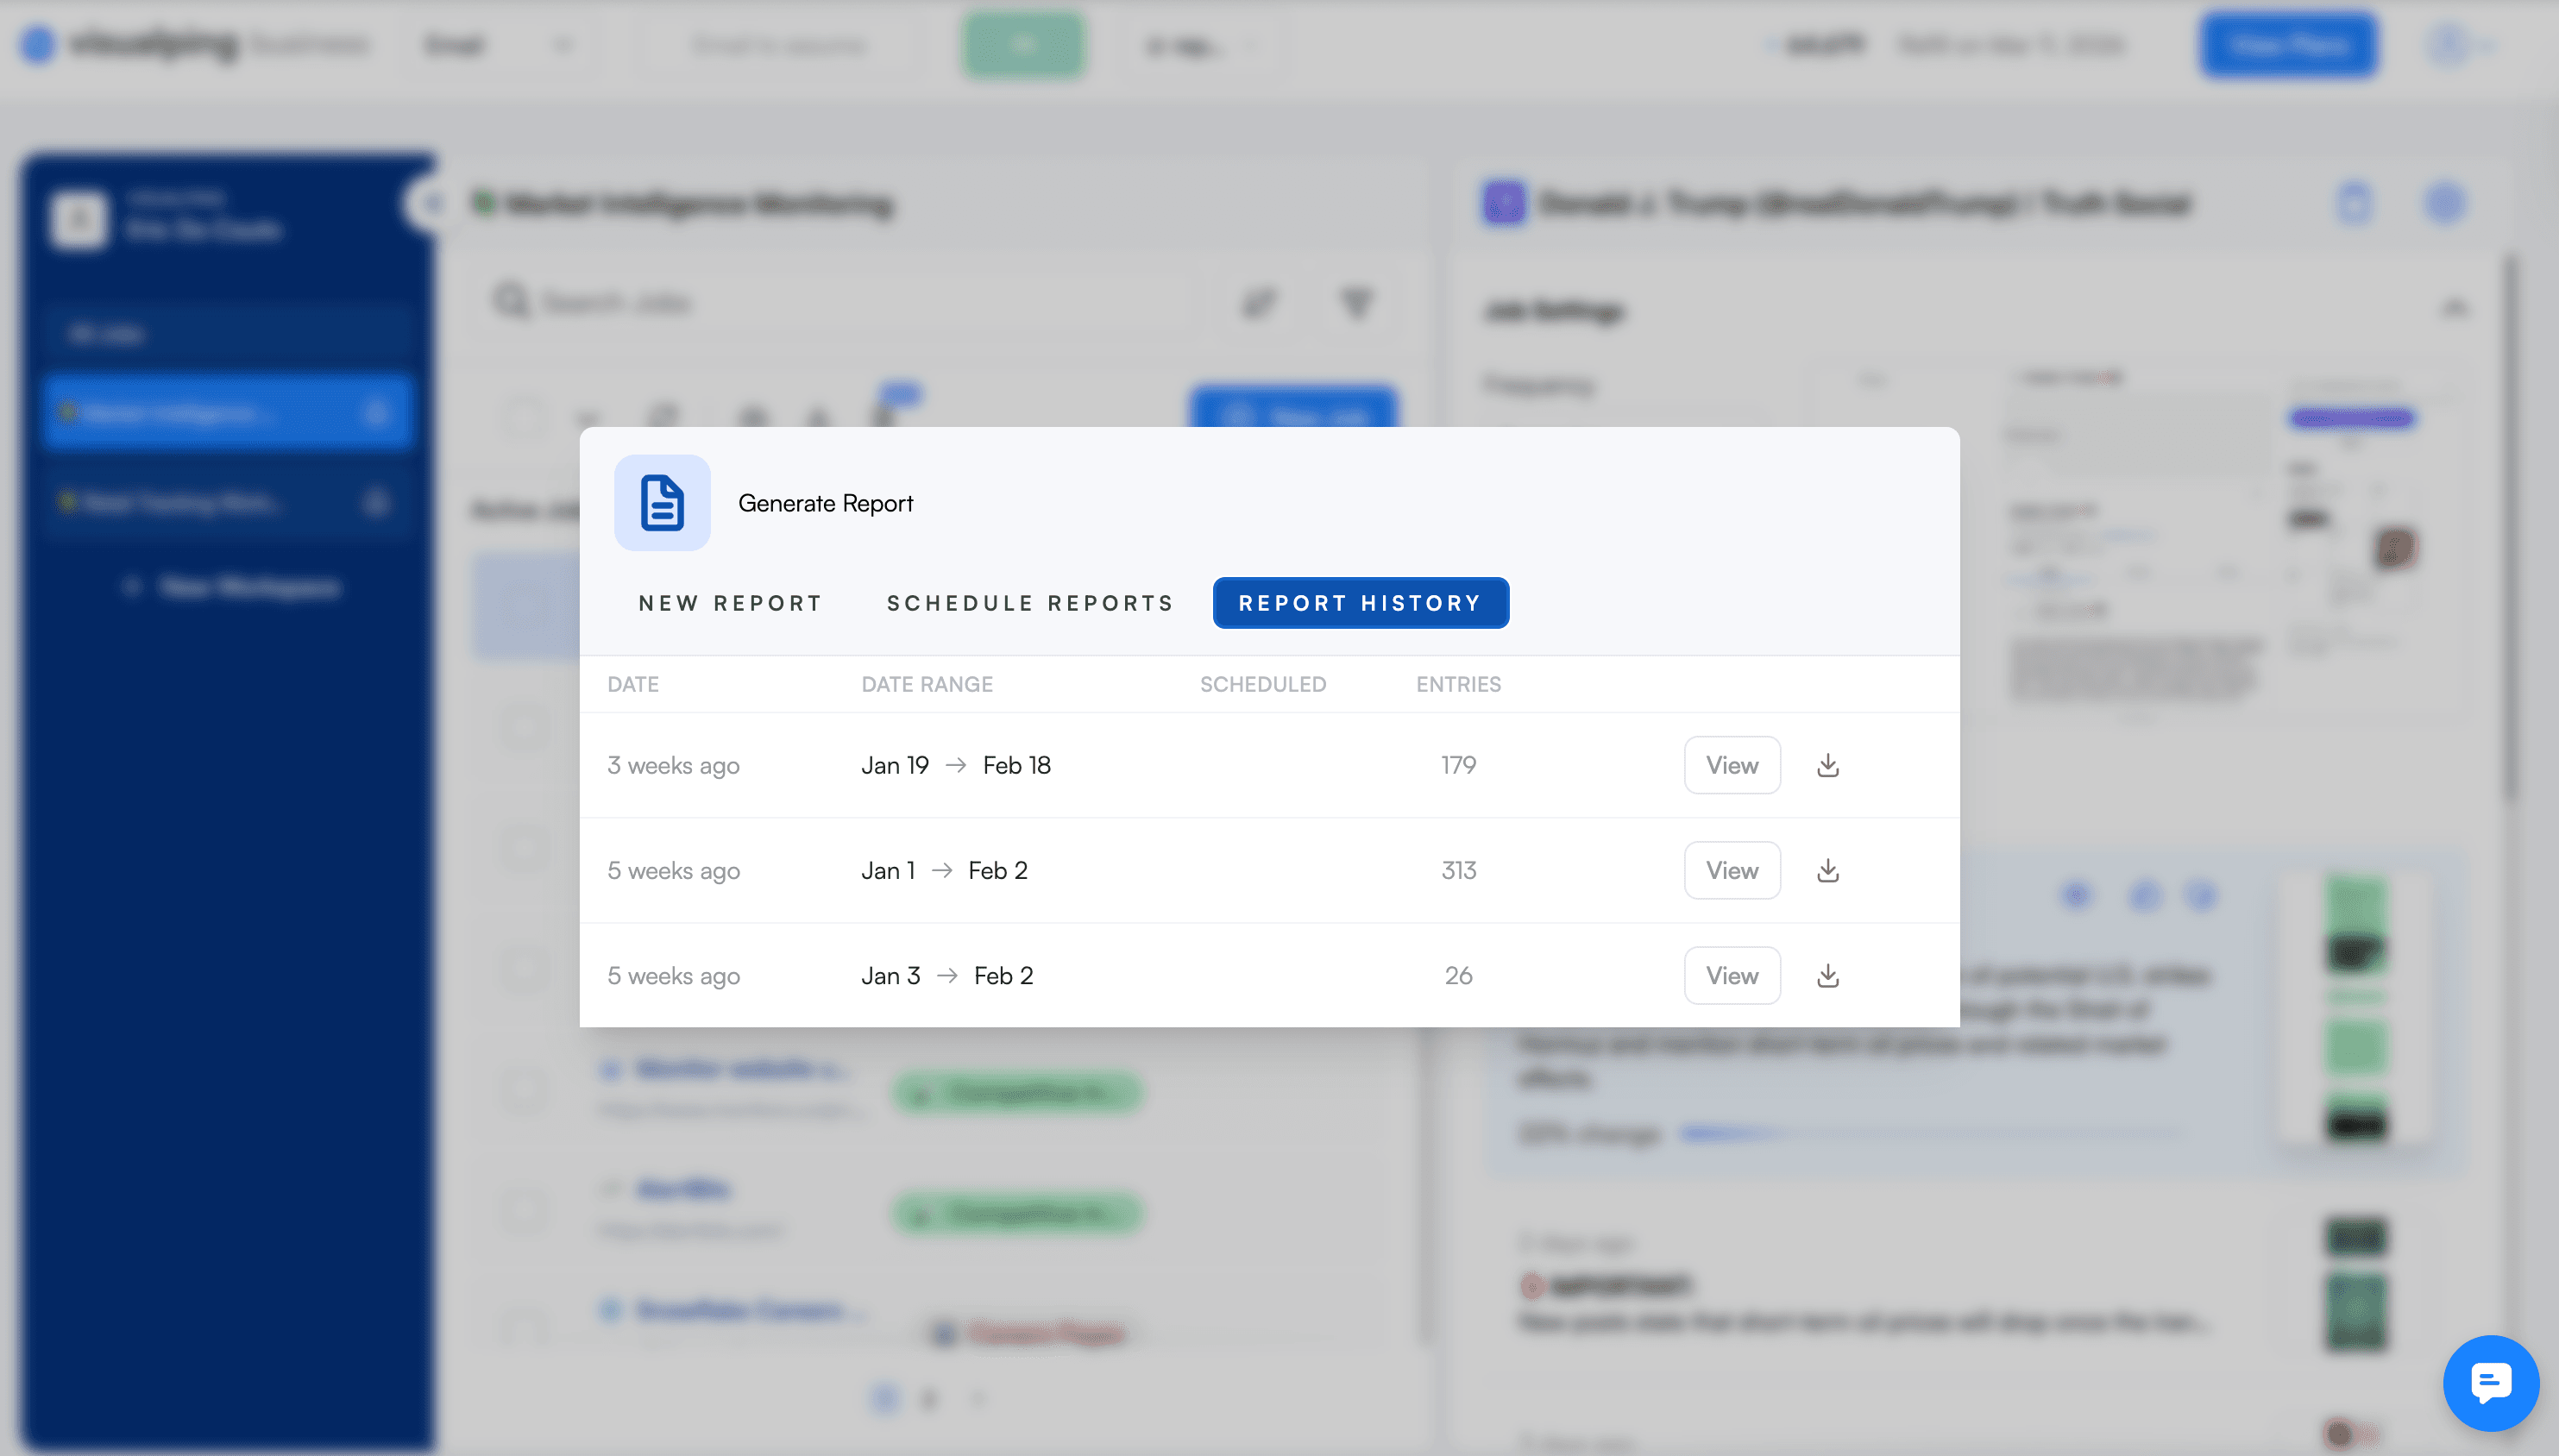
Every report goes wherever you need it: view in the dashboard, share via link or email, export as PDF, Excel, or CSV, or print directly. Your VP gets a link. Your analyst gets the CSV. Your client gets the PDF. Report History keeps a record of every briefing, so you can always go back and re-export or compare across periods.
Discuss what you find
A briefing you can only read is a starting point. A briefing your team can work through together is where intelligence happens.
Every change entry in a report supports comments, reactions, and flagging. When your CI analyst spots a competitor pricing shift, they can flag it and add a comment directly on the change: "Competitor A dropped enterprise pricing 15% — recommend we revisit our Q2 positioning." Your product marketer can reply with context from a recent sales call. The discussion happens where the evidence is, not in a separate Slack thread where the screenshots get lost.
For changes that don't need attention, hide them. Hidden changes stay in the report data but stop cluttering the view for your team. What's left is the signal, annotated with your team's analysis.
Who this is for
If you are a power user running dozens or hundreds of monitors, Reports replaces the daily chore of reviewing alerts one by one with a single briefing that surfaces what matters.
If you work in competitive intelligence, think of Reports as a periodic competitor briefing delivered at a fraction of what dedicated CI platforms charge. The AI summary identifies patterns across ad changes, pricing shifts, and content updates so you can brief leadership with confidence. Flag the changes that matter, comment with your analysis, and your team has a shared record of what happened and what it means. This is what we call Tier 1.5: the intelligence layer between individual alerts and enterprise CI platforms. Setup takes minutes, not months, and it's included with your Business plan.
If compliance is your concern, scheduled reports create an auditable, timestamped record of every monitored change within a defined period. Your team can comment directly on each change to document review dispositions — "Reviewed, no impact to current filing" or "Escalated to legal" — so auditors see both what changed and that your team acted on it. Export to Excel or CSV for your compliance monitoring archive.
If you are an executive or team lead who needs visibility without logging into another tool, a shared report link or scheduled email delivers a curated summary directly.
If you run an agency, Reports gives you a packaged deliverable. Generate a branded briefing covering the monitoring period, export it, and hand it to your client. The work you were already doing now has a professional output.
Explore 5 detailed workflows built on Reports to see how teams in each of these roles set up their first briefing.
Go deeper: What Is Competitive Intelligence? | Compliance Monitoring Software Solutions
Getting started
Reports is available now for all Business plan users. Your first report takes under two minutes. Head to the Reports tab in your workspace and hit Generate. To get briefings delivered automatically, set a schedule and your entire team receives them via email without extra setup. For a step-by-step walkthrough, see our complete setup guide.
Before generating a report, select which monitoring jobs to include using the checkboxes in your job list. Want a report on just your top three competitors' pricing pages? Select those jobs and leave the rest unchecked. Want everything? Select all. You can also organize workspaces by purpose (competitive tracking, compliance, brand protection) to keep each workspace focused.
Open Reports in your workspace →
Frequently asked questions
What is Visualping Reports? Reports is a feature that consolidates website changes detected across your selected monitoring jobs into a single briefing. You select which jobs to include, pick a date range, and generate a document with AI-summarized analysis, visual diffs, and importance flags. It can run on demand or on a recurring schedule.
How much does Visualping Reports cost? Reports is included free with all Business plans (approximately $100/month). There is a 14-day free trial if you want to test it with your existing monitors.
Can I choose which monitoring jobs go into a report? Yes. Before generating a report, select the jobs you want using the checkboxes in your job list. You can include everything in a workspace or cherry-pick specific jobs. This works for both on-demand and scheduled recurring reports.
How does the AI summary work? Toggle on "Report Summary & Analysis" when configuring your report. Visualping's AI reads across all detected changes in your selected jobs and writes a summary identifying patterns: pricing shifts, messaging changes, new content themes, competitive movements. The summary quality scales with data volume. It works best with 10+ active monitors and a full week of changes.
What export formats are available? Reports can be viewed in the dashboard, shared via link or email, exported as PDF, Excel, or CSV, or printed directly. Recipients do not need a Visualping account to view a shared report.
Is Visualping Reports a replacement for Klue or Crayon? No. Klue and Crayon are enterprise CI platforms with battlecards, CRM integrations, and win-loss analysis. Reports is a monitoring tool with an intelligence layer. For teams whose CI needs are primarily web-driven, Reports covers the aggregation and synthesis workflow at a fraction of the cost. For teams needing full enterprise CI capabilities, Reports can complement those platforms by handling web monitoring. See our detailed CI positioning comparison for more.
Can my team comment on or discuss changes within a report? Yes. Every change entry in a report supports comments, reactions, and flagging. Team members can add comments to discuss findings, document decisions, or ask questions directly on the change they're referencing. You can also flag changes for team visibility or hide irrelevant ones to reduce noise. All annotations are visible to workspace members who can access the report.
One briefing, every change
Visualping has always been about knowing when things change. Reports is about understanding what those changes mean: together, in context, on your schedule.
Stop reviewing alerts one at a time. Start getting briefed.
Open Reports in your workspace → Included free with all Business plans.
Reports launched alongside self-serve API keys, a native Zapier app, and smarter Important Alerts. See everything that shipped in the Q1 2026 release recap.
Want to monitor web changes that impact your business?
Sign up with Visualping to get alerted of important updates from anywhere online.
The Visualping Team
The Visualping Team is the content and product marketing group at Visualping, a leading platform for website change detection and competitive intelligence. We write about automation, web monitoring, and tools that help businesses stay ahead.