Visualping Reports Now Make It Easier to Share, Sort, and Review Changes
By Kayla Zhu
Updated October 6, 2026

TL;DR: Visualping Reports picked up five new improvements between July and October 2026. You can share a report as a link or a CSV, Excel, or HTML file, zoom into any screenshot, see who flagged or hid each change and when, flag changes in five colours, and narrow a report with a faster Filter panel. Reports is included with Business plans. Open it from the Reports button in your dashboard.
Since we launched Reports in April, we’ve been focussing on what happens after a report is created, when a team needs to review it, decide which changes matter, and pass the results along.
Visualping Reports brings every change your monitors detect into one place. Instead of reading alerts one at a time, you get a single report across all of your tracked pages, with an AI summary of what changed and the before-and-after screenshots behind each change.
You can open a report in your dashboard whenever you need it or schedule it to arrive in your inbox, so your team has one clear record of what moved on competitor sites, pricing pages, policies, and any other pages you track. It comes free on every Business plan.
Since July we've shipped a set of smaller improvements for our Reports workflow, covering how you share a report, mark the changes that need attention, see who reviewed what, and filter a report down to the monitors you care about. Together they make it easier for teams to work through a report and act on it with less back-and-forth.
Here’s what’s new.
Share a report with anyone who needs it
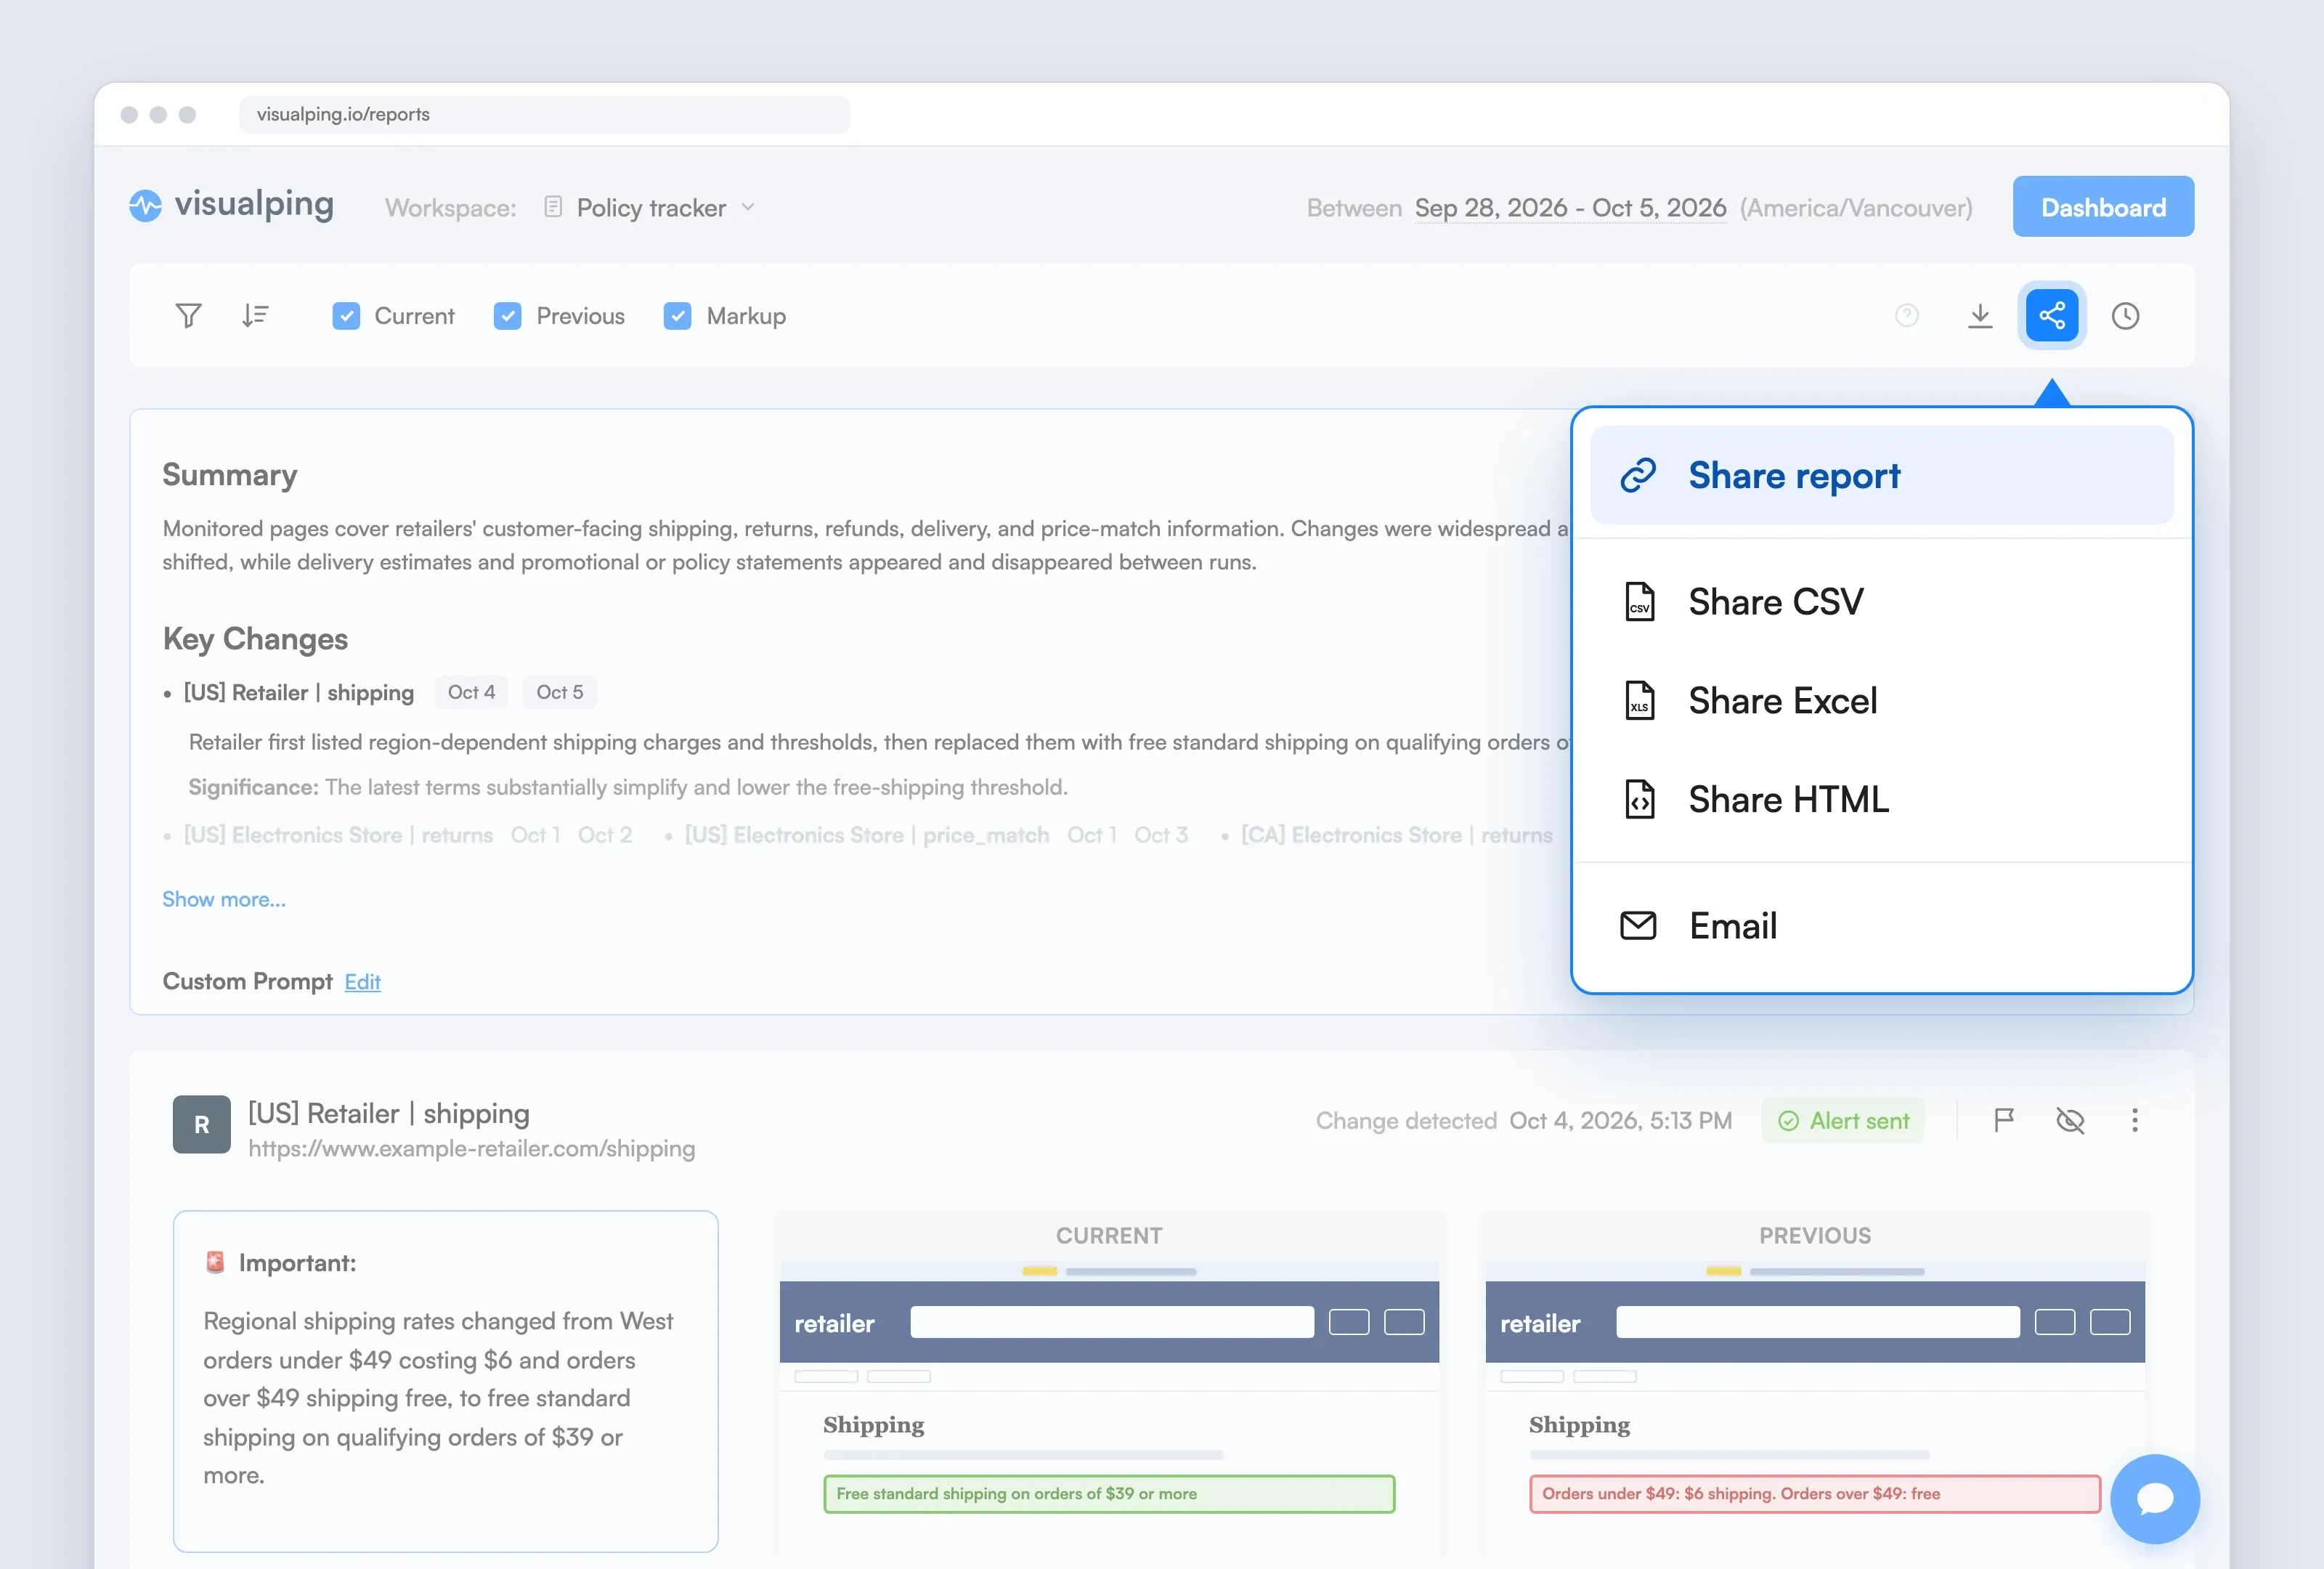
The Share menu in the Reports view gives you five ways to send a report: copy a report link, send it by email, or share it as a CSV, Excel, or HTML file.
The report link opens the live Reports page, so the person opening it needs a Visualping login and access to the workspace. The CSV, Excel, and HTML links work without a login, which makes them the right choice for a manager, a client, or a legal team outside your workspace. Save the report first, and the share options appear.
The exports carry the details you'd want in a spreadsheet: the change date, the monitor, the AI summary, comments, the flag colour, and a link to each before-and-after comparison.
Open Reports in your workspace →
Zoom in on any screenshot
Every screenshot in a report now opens in a zoomable viewer with minus and plus controls, a Fit button, and a 100% button. Zoom in to review changes to smaller text or elements, or pull back to see the whole page.
This matters most on long pages. Report cards show the top of a very tall capture, and the zoom viewer holds the full page, so you can scroll down a long product listing or policy page without opening the monitor.
See who flagged or hid each change, and when
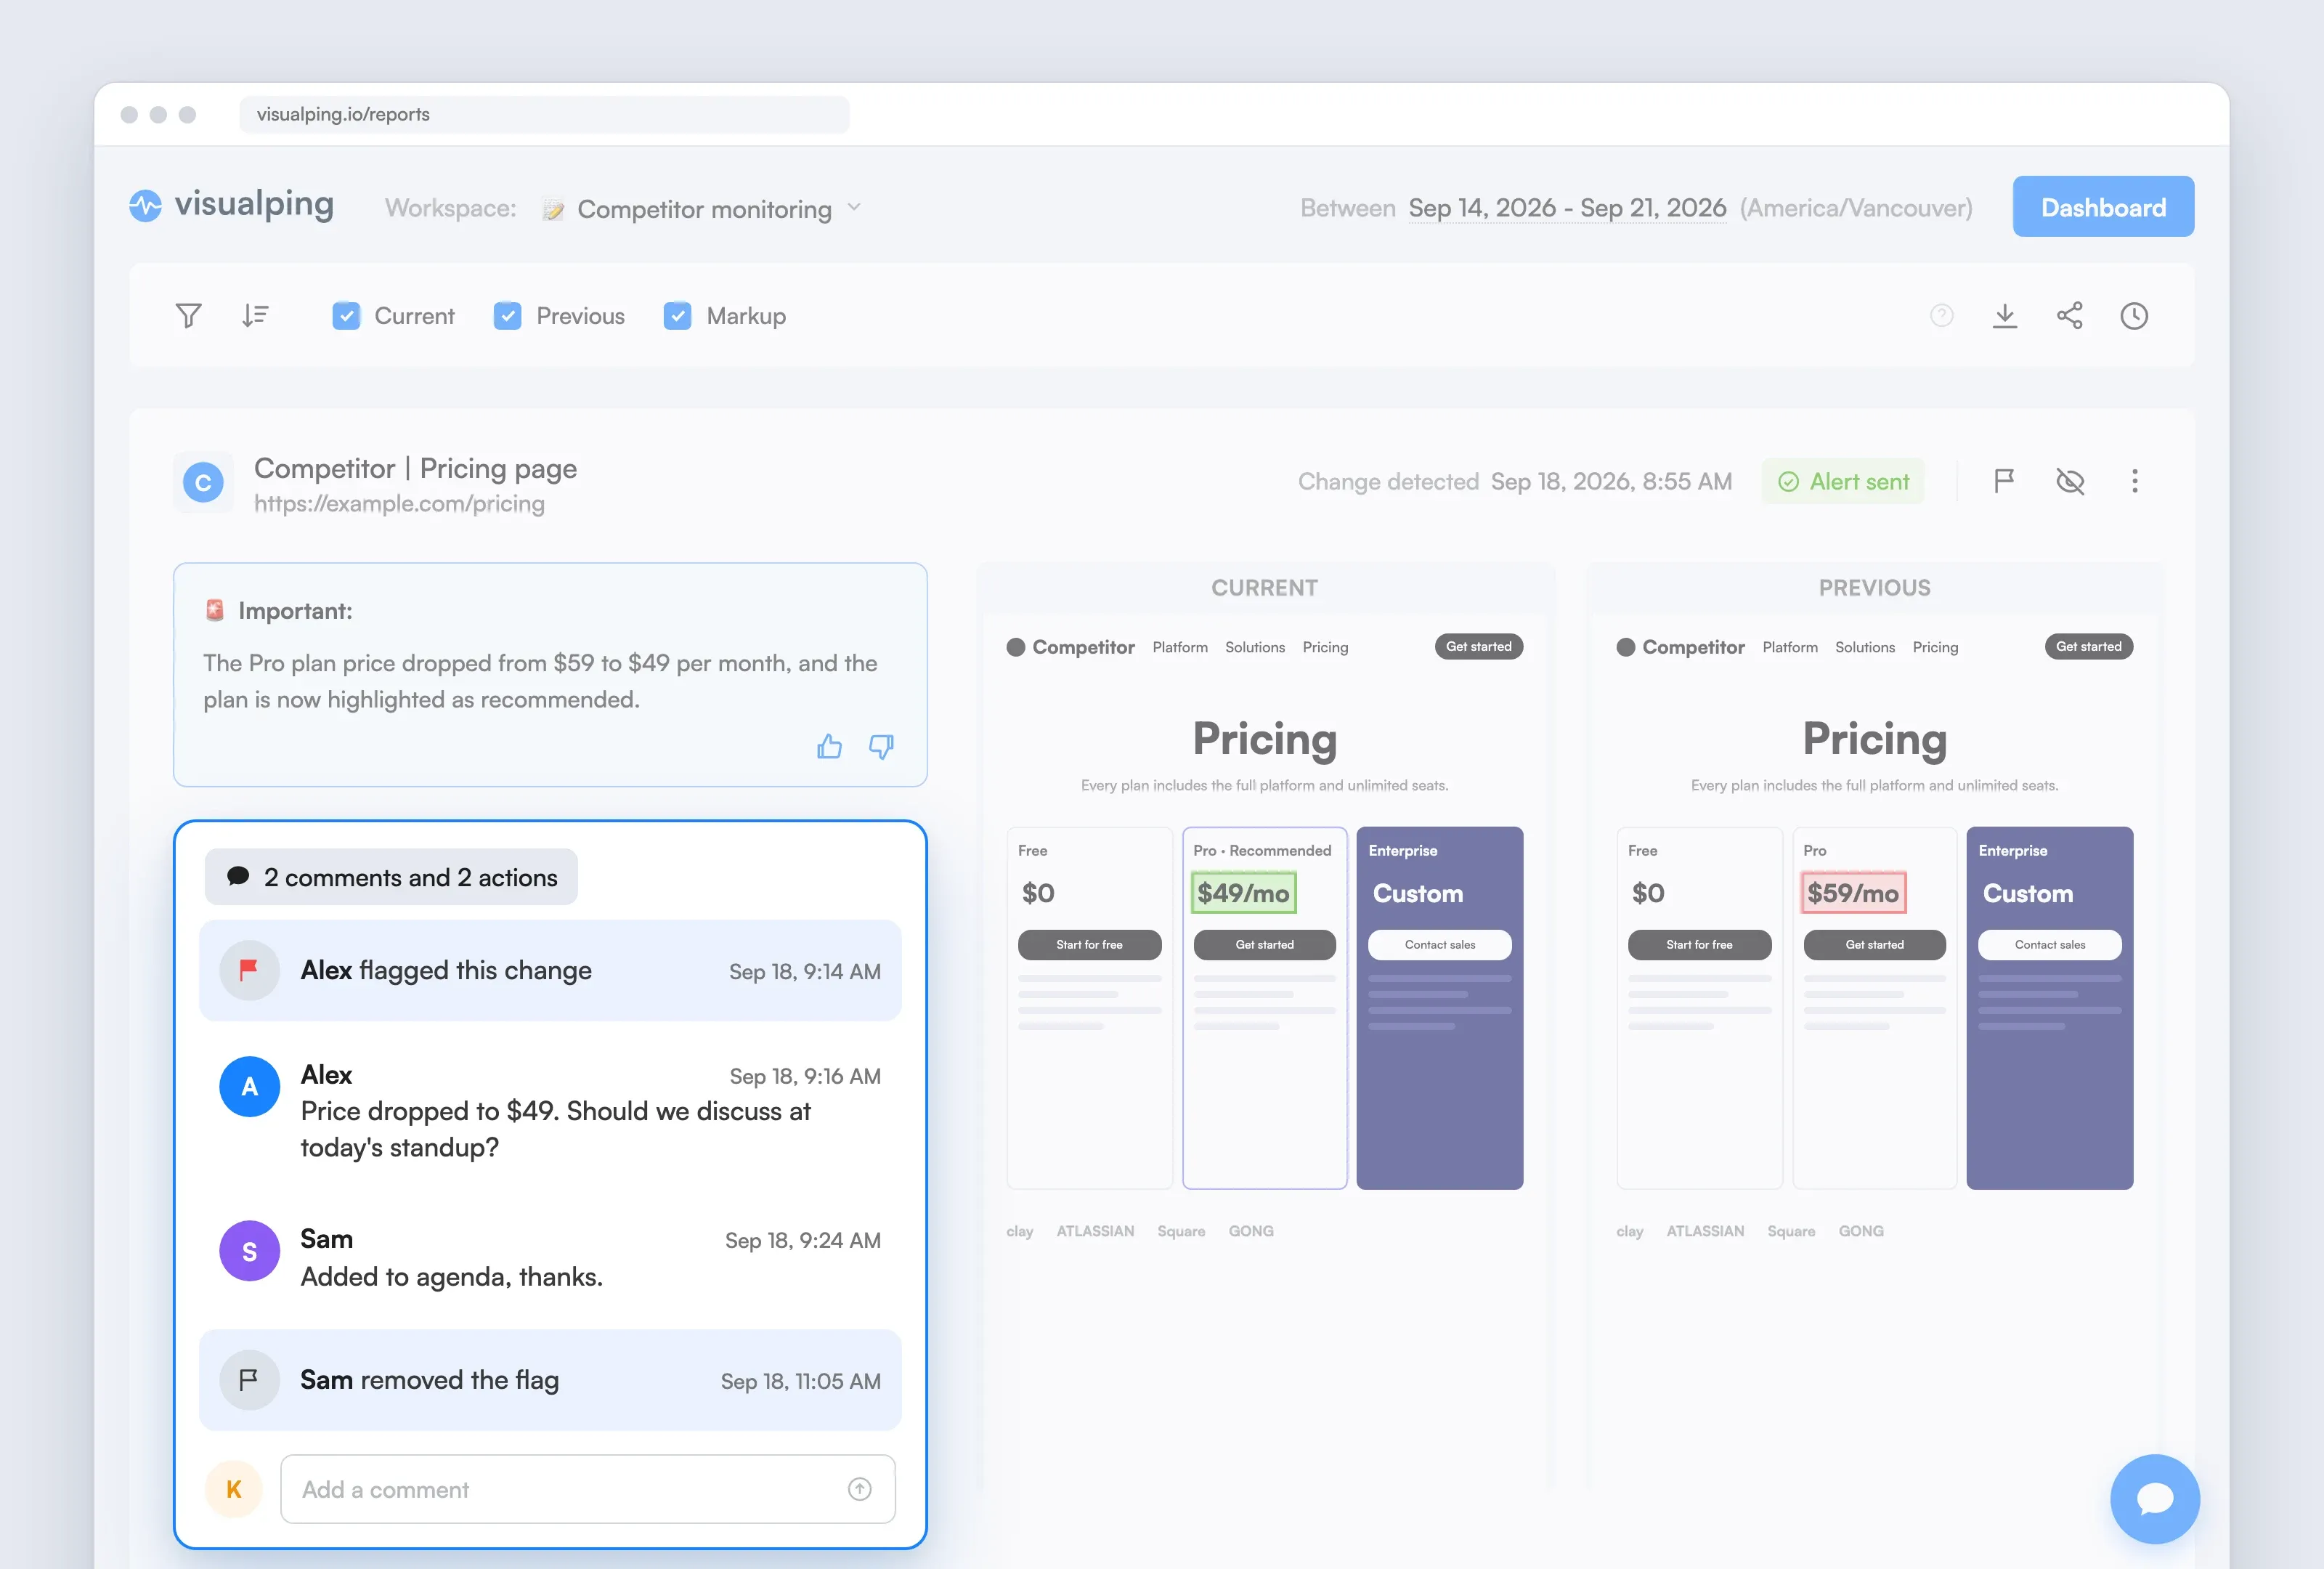
Every change card in a report now shows its full flag and hide history next to its comments. Open the comments on a change and you see each action in order with the person's name and a timestamp, such as "Alex flagged this change", "Alex changed the flag to green", "Sam hid this change", or "Sam removed the flag".
Actions and comments sit in one feed, so the discussion and the decisions stay together. A teammate can flag a competitor's price drop and ask to discuss it at standup, another can reply that it's on the agenda, and the flag comes off once the team has talked it through. The count on the comments button includes both, for example "2 comments and 2 actions".
The history reaches back to February 2026, when flags first shipped, so changes your team flagged or hid before this update already have a record.
Colour-code your flagged changes

We've added four new flag colours, so flags now come in red, green, yellow, blue, and purple to help teams categorize alerts within Reports. The colours have no built-in meaning, so your team can decide. One team might use red for urgent, yellow for review, and green for resolved. Another might give each colour to a client or a region.
Pick a colour from the flag button on any change card in your report. A flagged card takes a border in its colour, so the urgent items stand out as you scroll.
To filter by colour, open the Filter panel in your report and use the five colour chips in the Flagged row. Switch a chip off and changes with that colour leave the view, the counts, and any export or report you save from that page.
Filter a report down to what matters
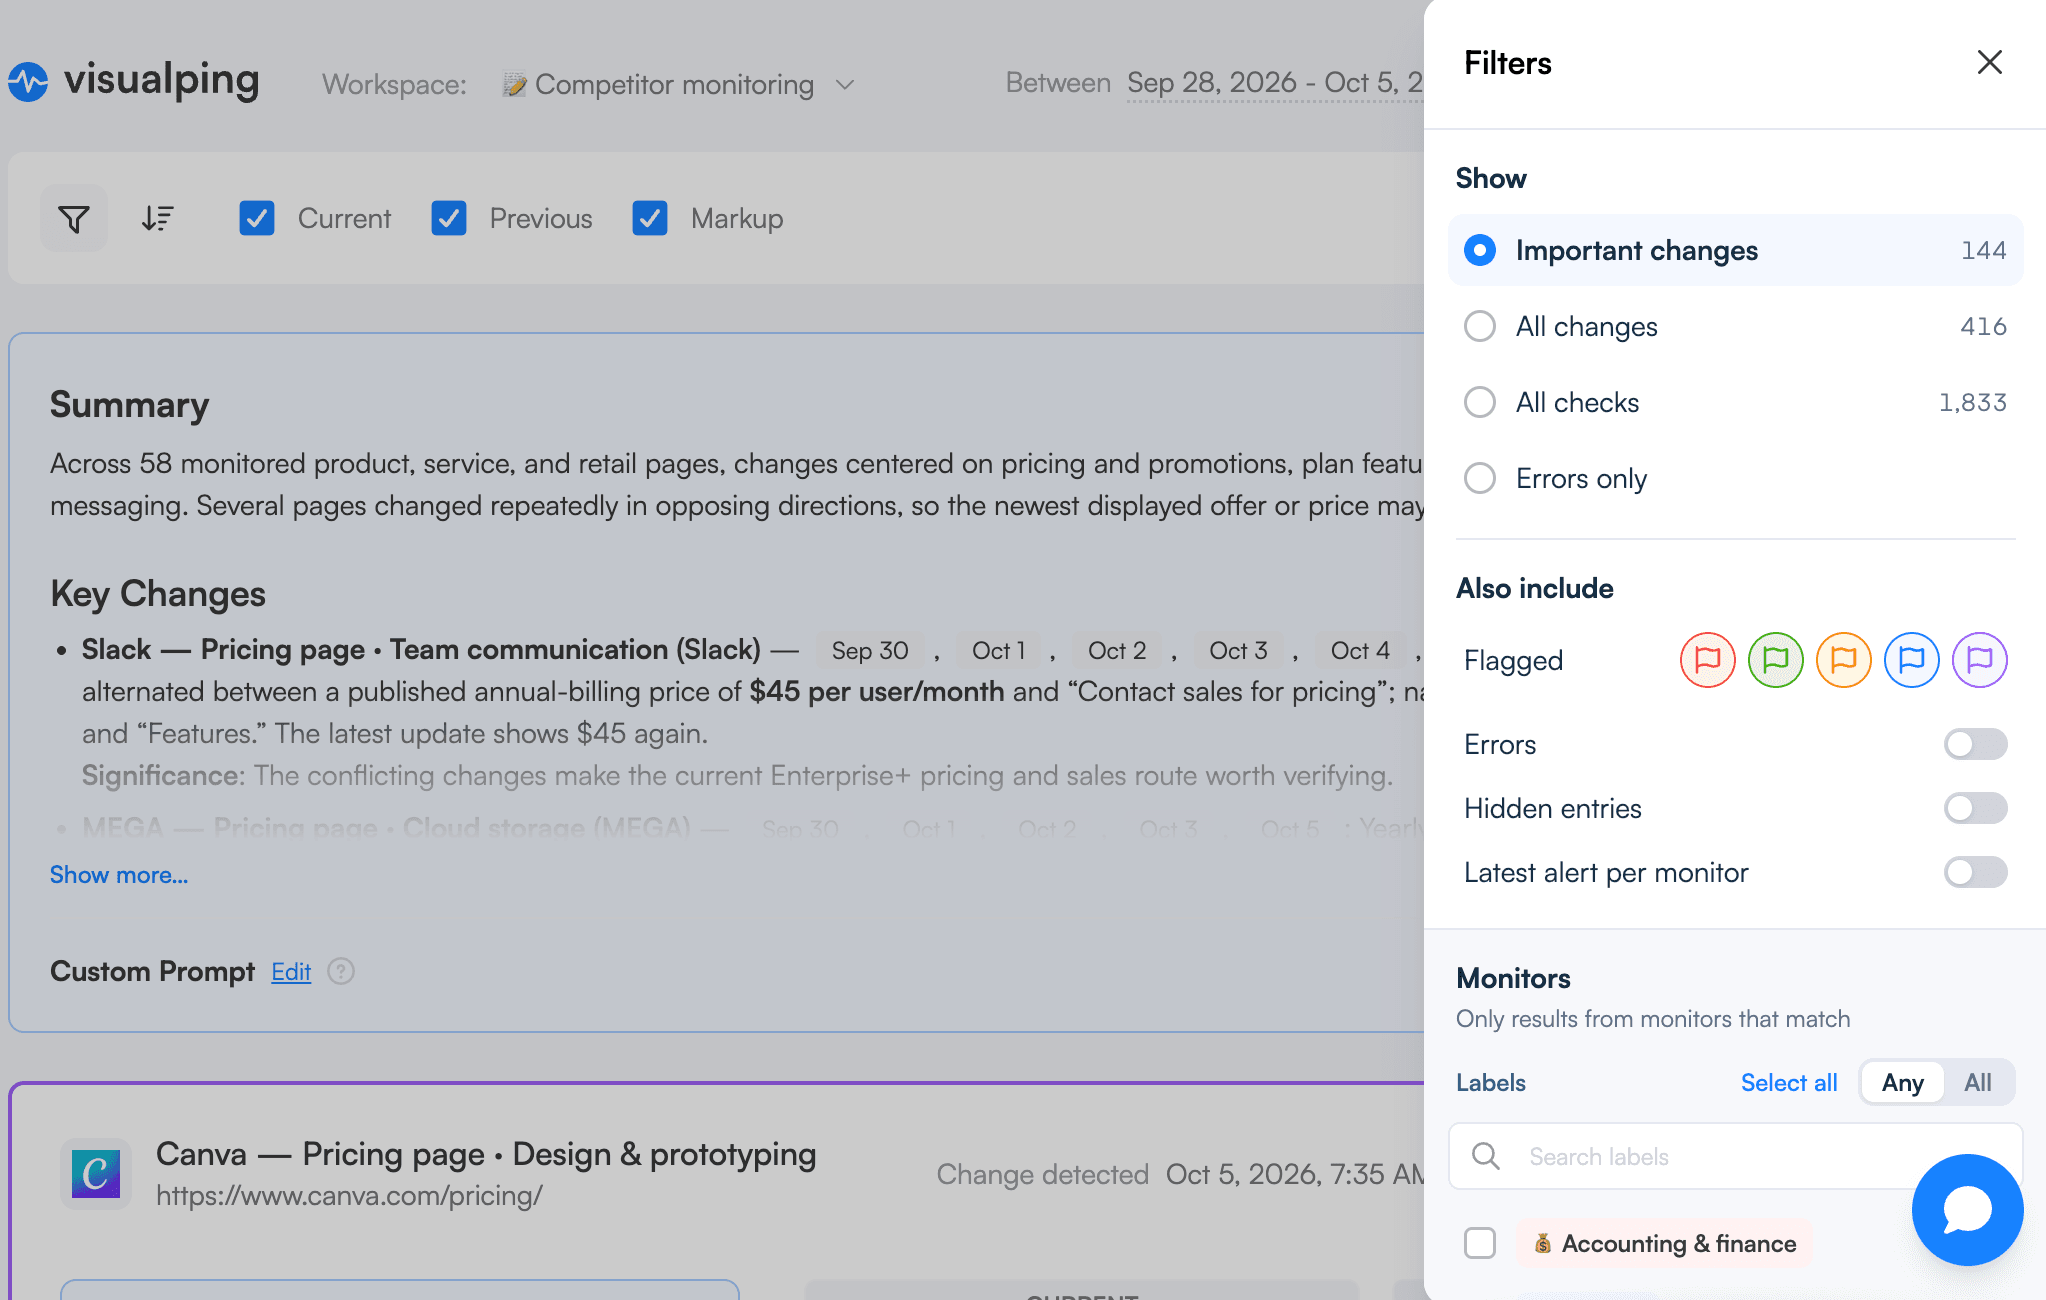
Filters in Reports now open in a side panel built around three sections, with one-tap buttons instead of long checkbox lists.
Show picks the level: Important changes, All changes, All checks, or Errors only, each with an estimated count. Also include holds the flag colour chips and switches for Errors, Hidden entries, and Latest alert per monitor. Monitors narrows the report to monitors that match your labels (any or all), check frequency, schedule type, and status. The label list also has Select all and Clear buttons, so you can pick or drop every label in one click.
A Reset button appears when any filter is on and returns everything to the defaults in one click, keeping your date range and sort. Saved reports and old report links open exactly as before.
Getting started
Everything here is live now, with no setup and nothing to turn on.
- Click Reports in your Visualping dashboard and open a report.
- Use the flag button on a change to pick a colour.
- Open the Filter panel to narrow the report, then save it.
- Use Share to send the saved report as a link or a file.
Reports, sharing, and exports are included with Business plans. Flagging requires edit rights in the workspace. Viewers can see flags, colours, and the history, and can use the filter chips.
Frequently asked questions
Which plans include Visualping Reports? Business plans. Reports, scheduled report emails, sharing, and exports are part of the Business plan.
Can I share a Visualping report with someone who doesn't have an account? Yes. Save the report, then share it as a CSV, Excel, or HTML file link, which opens without a login. The report link itself requires a Visualping login and access to the workspace.
Can I filter Visualping Reports to show only flagged changes? Not yet. The flag colour chips remove colours you switch off, and unflagged changes always stay in view. To bring flagged changes to the top, use the Flagged First sort.
Do flag colours work in scheduled report emails? Not yet. Flag colour filtering lives in the Reports page Filter panel and in reports you save from that page. The scheduled report form has no flag option.
Is the flag and hide history included in exports? No. The history appears on Reports page cards only. CSV, Excel, and HTML exports show each change's current flag colour, not the history.
Review changes as a team
Reports now covers the whole review loop: see what changed, decide what matters, record who handled it, and send the result to whoever needs it. For everything else Visualping shipped this quarter, read the Q3 2026 release recap.
Open Reports in your workspace → Included free with all Business plans.
Not a Visualping user yet? See a weekly Reports briefing.
Want to monitor web changes that impact your business?
Sign up with Visualping to get alerted of important updates from anywhere online.
Kayla Zhu
Kayla is the Public Relations Specialist at Visualping and manager of Visualping's Journalist Program. She manages Visualping's media relations, content marketing, and social media.
More articles by Kayla Zhu