Stock Market Research: A Complete Guide
By Emily Fenton
Updated December 11, 2024

Introduction
Stock market research is essential for investors, portfolio managers and research analysts navigating an often-turbulent financial landscape. With markets becoming increasingly complex, having quality information isn’t just advantageous—it’s key.
As investment opportunities multiply and market dynamics shift, investment professionals use a variety of stock research tools, like Visualping, to conduct stock market research, to make more informed investing decisions.
In this guide, we’ll explore the ins and outs of stock market research, its benefits, common sources of stock market research, and a few top tools for making more informed investment decisions.
Stock Market Research Defined
Stock market research is a method of researching stocks in terms of various factors, including the company’s financials, leadership team and competition. Stock research helps investors evaluate a stock and determine whether it should be included in their portfolio.
Similarly, stock market analysis is a method of evaluating and investigating an investment or the stock market.
Different Types of Stock Analysis
There are three main types of stock market analysis:
- Fundamental analysis
- Technical analysis
- Quantitative analysis
1. Fundamental Analysis
Fundamental stock market analysis is a method of evaluating a stock's intrinsic value by analyzing the financial, economic, and qualitative factors that influence a company’s performance. This approach seeks to determine whether a stock is overvalued or undervalued by assessing the company’s actual worth relative to its market price.
2. Technical Analysis
Technical stock market analysis is a method of evaluating stocks based on historical price movements, trading volumes, and other market data to predict future price trends.
Unlike fundamental analysis, which focuses on a company's intrinsic value, technical analysis assumes that all relevant information is already reflected in the stock's price and focuses on market behavior to guide investment decisions.
3. Quantitative Analysis
Quantitative stock market analysis is a data-driven approach to evaluating stocks and making investment decisions by using mathematical models, statistical techniques, and numerical data. It focuses on identifying patterns, correlations, and trends in historical and real-time market data to predict future performance and assess potential risks and returns.
It involves mathematical and statistical modeling to review data, the goal being to identify general trends based on what has happened in the past (not necessarily tied specifically to the stock price).
3. Sentimental Analysis
Aside from fundamental analysis and technical analysis, analysts can leverage other less formal ways to analyze the price of a stock.
Sentiment analysis refers to evaluating the emotions, attitudes, and opinions of market participants to inform investment decisions. It involves assessing market sentiment—whether investors are broadly optimistic (bullish) or pessimistic (bearish)—to identify potential opportunities or risks in financial markets.
By understanding crowd behavior and psychological trends, sentiment analysis helps investment managers anticipate market movements that may not be immediately evident from fundamentals or technical data.
Analysts can perform sentiment analysis by engaging with social media and news to gauge public perception of a given company.
Stock Market Research Benefits
Stock market research plays a pivotal role in informed decision-making, because, in a few different ways, it gives investment professionals the information advantage they need to generate alpha.
1. Catch indicators before everyone else
Market trends, economic indicators, and news events can seriously impact investments. Stock market research enables investors to stay one step ahead by, for example, catching signs of these shifts before they become public knowledge, for an information advantage.

To do so, investment professionals will integrate stock research tools, beyond the industry standards, to monitor and detect changes to web data on specific web sources. While the Bloomberg Terminal and Morningstar Direct are established staples that have been around a long time, website change detection tools are a common approach for detecting leading economic indicators, before they become public knowledge.
See top Bloomberg Terminal alternatives for more tools.
2. Thoroughly analyze and understand
On the other hand, stock market research enables investors to thoroughly analyze and understand a given topic in a niche focus area, allowing for more informed decisions. For instance, value investing and growth investing each require a unique approach, but they both hinge on thorough research to uncover the best opportunities.
3. Keeping up with changes
Moreover, the stock market is always evolving. That means ongoing learning and adapting are vital. By regularly engaging in stock market research, you enhance your chance of spotting emerging trends, thereby aligning your strategy accordingly. Knowledge is power, and in the world of trading, it can make all the difference.
Stock Market Research Common Sources
From macro industry trends to more specific event-driven investing opportunities, here’s a look at some of the top web sources to monitor to more easily generate alpha.
Corporate Performance and Equity Research
1. Price & Product Stock Patterns
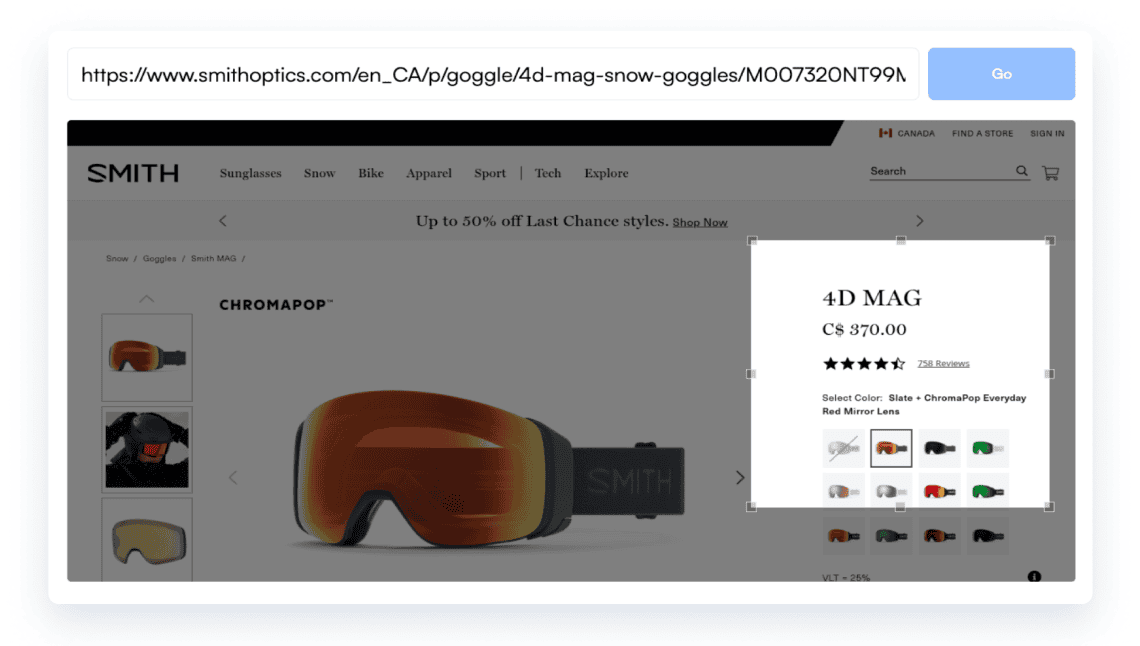
One of the many ways you can understand the fundamentals of specific companies is to track their pricing and stock changes over time, which is why analysts and portfolio managers tend to use Visualping as a price tracker. Pricing and stock patterns can help you estimate the sales volume of certain products, and estimate whether the eCommerce retailer will meet their quarterly targets. As well as getting a sense of corporate performance, you can gauge consumer trends over time, too.
2. Consensus & Analyst Pages
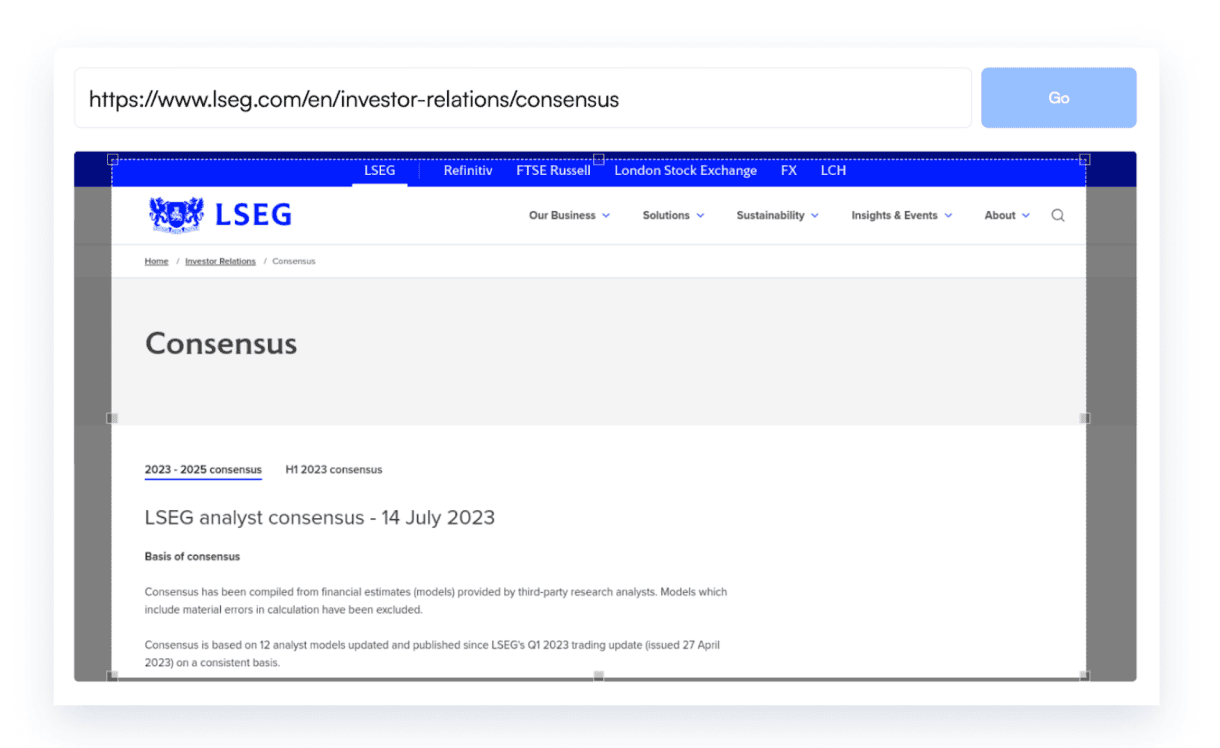
Hedge funds often use Visualping to collect data from specific companies’ consensus and analyst pages. You can automatically compile the updates into a structured format, such as in Google Sheets, with Visualping’s Google Sheets integration. This allows you to more easily assess a company’s performance overtime – and even compare it to competitors.

3. Geographic Presence
New markets are a sign of growth. Understanding whether or not a company is expanding, the extent to which a company is expanding, and where can tell you a lot about how a company is doing, and the potential for future plans. Visualping has both a textual and visual monitoring option, the latter of which lets you capture web page pixels, making monitoring maps, images and visual changes easy.
4. Executive Team Pages
Another way to keep an eye on corporate performance is to monitor the executive team changes on your portfolio company’s websites. Whether a company is hiring can tell you a lot about the state of the business.
5. Financial Statements and Balance Sheets
Website tracking tools can be used to notify you every time a company publishes any one of its financial statements and balance sheets online, sparing you from rechecking whether or not it’s become available.
General Information Gathering and Market Trends
7. News and Press Releases
Tracking your favorite financial news outlets is a great way to stay on top of the latest headlines and get a sense of market trends more generally. Use Visualping’s keyword alerts feature to only get notified of certain keywords and phrases, for tailored news alerts on the exact topics you’re interested in.
8. Other Investment Firms
Keeping an eye on other investment firms can be a source of competitive intelligence, as well as a way to evaluate potential new investments. Monitor everything from other investment firm’s blog posts, press releases, team changes and portfolio pages to keep track of all the deals and moves that you care about.
9. Acquisition Opportunities
Monitor marketplaces that list small businesses for sale to discover buying opportunities, or use Visualping to watch target companies more closely.
10. Search Results
Search engine results can tell you a lot about industry trends more generally. A noticeable rise in news and press releases about a specific company, for example, can tell you a lot about the narrative surrounding a particular brand of interest. You can leverage Visualping as a search engine monitoring tool -- to strategically gauge shifts in public perception, news, and industry trends in your focus area.
Current Stock Market Research Methods
Typically, portfolio managers and investment professionals rely on a variety of methods to conduct stock market research – as they should. Certain tools are designed to provide certain types of data that others aren’t. As such, stock market research usually includes a combination of methods, commonly including financial news, analysis reports, and analyzing preset datasets from third-party data providers.
Other stock research methods include industry staples, like the Bloomberg Terminal and MorningStar. But many of these methods and tools, while providing comprehensive market and news information, lack granularity and specificity in the kinds of updates you can monitor.
And, once a market development hits the news, you lose the information advantage of detecting the update ahead of public general knowledge. Delays in data can also lead investors to make decisions based on outdated information.
This is why many portfolio managers and analysts integrate Bloomberg Terminal alternatives, like Visualping, into their stock market research processes.
Website Change Monitoring Tools
Stock Market Research with Web Change Alerts: Visualping
Visualping is a AI-powered market research solution that notifies you of changes on any web pages. For stock analysts, that means it can monitor stock prices, news updates, and other critical financial data with ease.

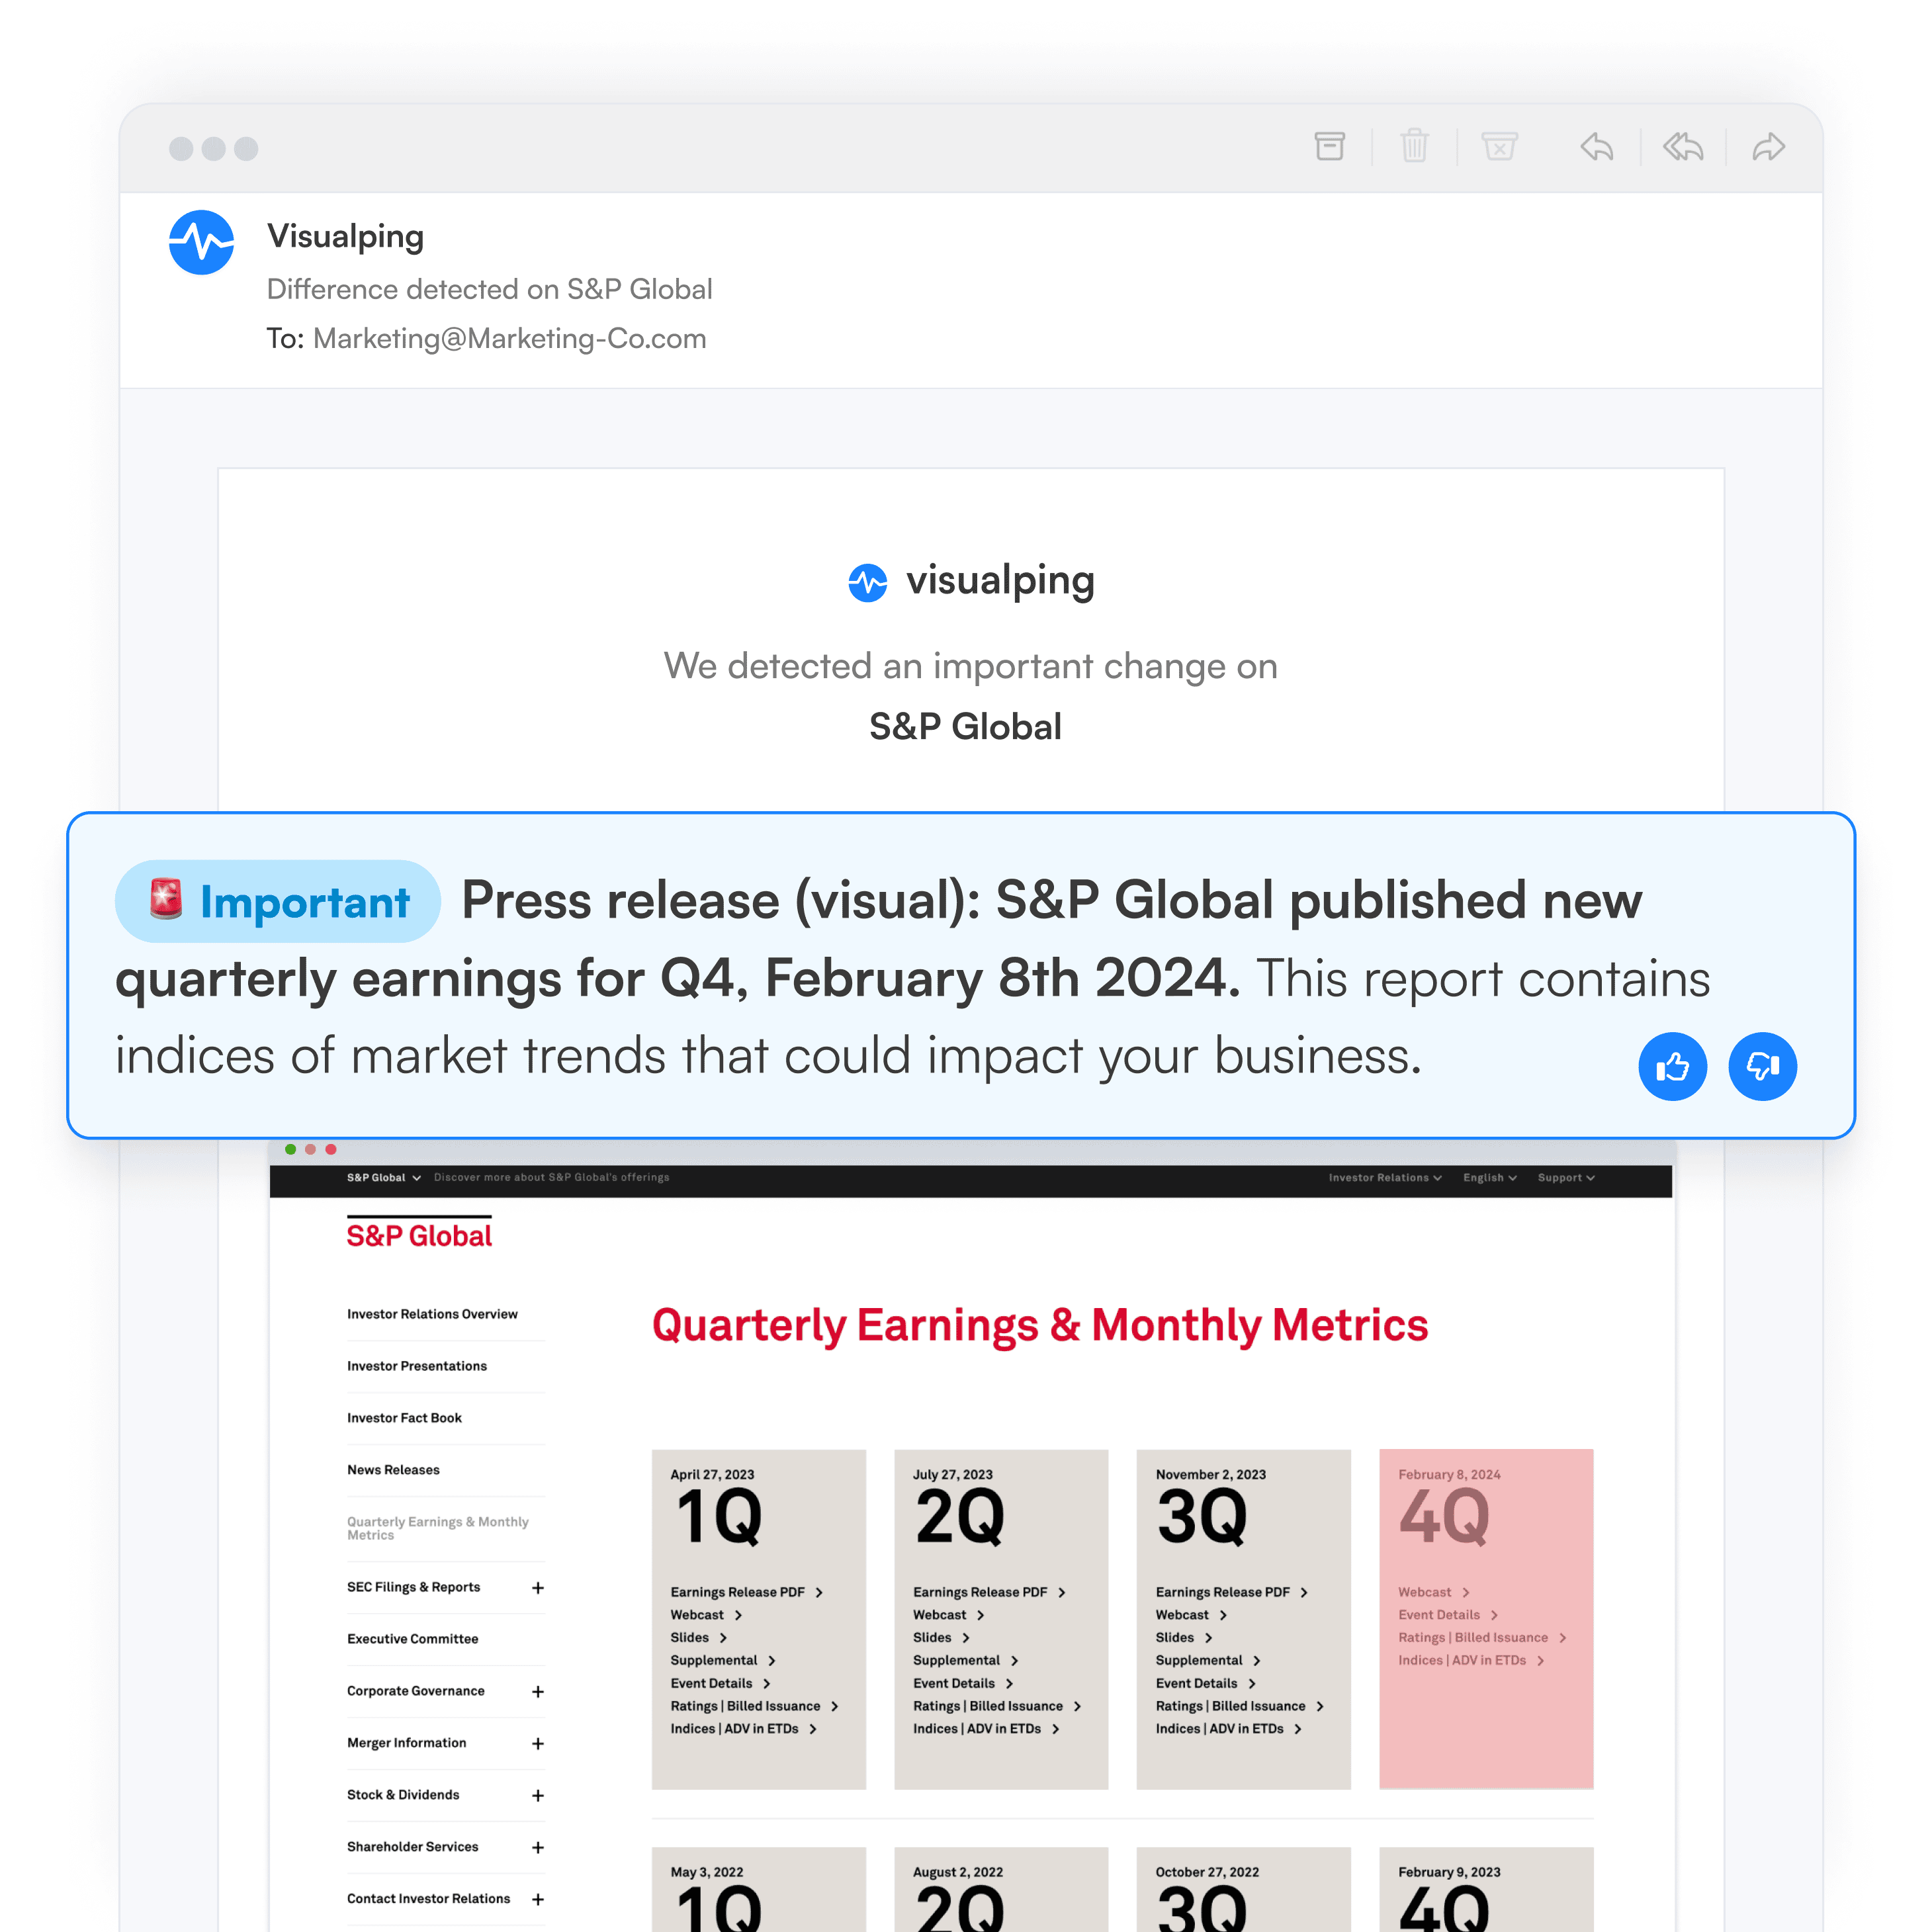
When an update occurs, you get an email alert that includes an AI-generated summary of the change, distilled in two to three lines. The alert also includes a screenshot of the page, with the changes highlighted, so it's easy to understand what happened.
It’s best for Portfolio Managers and Research Analysts looking to supplement their stock research processes with a versatile web monitoring tool that can extract the exact granular web data their investment hypothesis requires.
From its database of over a hundred thousand web sources, Visualping’s team imports a custom set of web sources that match your criteria – such as the financial data you’re after, related to your focus area and industry.

As a website change monitoring tool, you can also add your own web sources. Visualping’s team will set up the monitoring for you.
Conclusion
Effective stock market research is crucial for successful investing and managing your portfolio. Visualping offers powerful tools to enhance and streamline your research efforts, allowing you to stay ahead of market dynamics. So why not check out Visualping and see how it can optimize your stock market research strategies? Contact us to learn more.
Want to uncover leading market signals?
Monitor any web source online, and get notified of market-moving events, with Visualping.
Emily Fenton
Emily is the Product Marketing Manager at Visualping. She has a degree in English Literature and a Masters in Management. When she’s not researching and writing about all things Visualping, she loves exploring new restaurants, playing guitar and petting her cats.