Competitive intelligence reports without a $16K CI platform
By The Visualping Team
Updated March 12, 2026
TL;DR: Enterprise CI platforms like Klue and Crayon start at $16K+/year. Visualping Reports fills the gap for mid-market teams: AI-summarized briefings that consolidate website changes across all your monitors, delivered on a schedule, for ~$100/month. It covers the web-monitoring layer of competitive intelligence (pricing shifts, messaging changes, feature launches) at a fraction of the cost. Not a full CI platform, but for teams whose CI needs are primarily web-driven, it handles 80% of the workflow.
Mid-market CI teams face an expensive paradox: the tools that aggregate competitive intelligence cost more than most teams' entire CI budget.
There's a gap in the market, and it's exactly where most teams operate. If you run competitive intelligence at a company with 50 to 500 employees, you already know the drill. You need to track what competitors are doing: pricing changes, messaging shifts, new product launches, updated positioning. You need that information aggregated into something you can share with your team weekly, not buried in a flood of individual email alerts.
So you evaluate CI platforms. You book demos with Klue and Crayon. The products are impressive. Then you see the pricing: $16,000 to $40,000 or more per year, with multi-month onboarding, dedicated analyst requirements, and feature sets built for organizations with full-time CI teams.
You don't have a full-time CI team. You have a product marketer who owns competitive intelligence alongside four other responsibilities. Or you're a strategy analyst who tracks competitors between board deck cycles. Or you're the founder, and "competitive intelligence" means you personally checking competitor websites when you remember to. For the sales-facing slice of the report, a dated battlecard template is the lightest-weight format.
The enterprise CI platforms are built for a different organization than yours.
What mid-market CI teams actually need
Enterprise CI platforms like Klue and Crayon sell a comprehensive vision: battlecards pushed to Salesforce, win-loss analysis pipelines, AI-generated intel newsletters, competitor profiles maintained by dedicated analysts, CRM integrations that surface competitive context during sales calls.
That's a legitimate product for companies with dedicated CI functions, large sales teams, and the budget to support a $20K+ annual tool alongside the headcount to operate it.
Most mid-market teams need something more fundamental. They need the answer to one recurring question: What did our competitors change on their websites this week?
That question covers a lot of ground: pricing page updates, new case studies and social proof, messaging repositioning, feature launches, job postings that signal strategic direction, blog content that reveals go-to-market shifts. Website changes are the most reliable public signal of competitive activity, and for many mid-market teams, tracking those changes covers roughly 80 percent of their CI needs, provided their intelligence is primarily web-driven. If you need win-loss analysis, sales battlecards embedded in your CRM, or multi-channel media monitoring, you're in enterprise CI territory and should evaluate accordingly.
But if your CI workflow is fundamentally about monitoring what competitors are doing on the web and synthesizing it for your team, you're being underserved by the current market. (For the full feature overview, see our Reports announcement.)
The market gap: individual alerts vs. enterprise platforms
The competitive intelligence tool landscape has a structural gap. It breaks into two tiers with almost nothing between them.
Tier 1 tools ($0–$50/month) detect changes and send individual alerts. Tools like Distill.io, ChangeTower, and basic website monitoring setups will notify you when a specific page changes. The problem: ten competitors across five monitored pages each generates 50 separate alert streams. There's no aggregation, no synthesis, and no way to share a consolidated view with your team. You become a human middleware layer, manually assembling intelligence from a torrent of pings.
Tier 2 platforms ($16K–$40K+/year) provide aggregated intelligence, AI-powered analysis, sales enablement, and CRM integration. Klue and Crayon are the leaders here, with Contify and Kompyte filling adjacent segments. These platforms are powerful. They're also priced for organizations that treat competitive intelligence as a dedicated function with its own budget line and headcount.
| Individual Alerts | Visualping Reports | Enterprise CI (Klue/Crayon) | |
|---|---|---|---|
| Output | One alert per change | Consolidated digest with AI summary | Battlecards, newsletters, dashboards |
| Team collaboration | None | Comments, flags, hide | Battlecards, CRM integration |
| Setup time | Minutes | Minutes | 3-6 months |
| Cost | $0–50/mo | Included free with Business plan (~$100/mo) | $16K–40K+/yr |
| Best for | Tracking a single page | Tracking everything across a workspace | Full CI team with CRM needs |
The gap between $50/month and $16,000/year is enormous, and it's exactly where most mid-market CI practitioners operate. They've outgrown individual alerts but can't justify (or don't need) an enterprise platform.
What a Tier 1.5 solution looks like
Visualping is a website change detection platform used by over two million users, including teams at 85 percent of Fortune 500 companies. At its core, it monitors web pages and detects changes, solidly in Tier 1 territory.
Visualping Reports pushes into the gap between tiers. Reports creates consolidated change digests across your selected monitoring jobs, layering AI-generated summaries on top. You choose which jobs to include using checkboxes in your job list before generating each report.
Here's what that means in practice:
Selective aggregation
Before generating a report, select which monitoring jobs to include using the checkboxes in your job list. Want a report on just competitor pricing pages? Select those. Want everything in the workspace (competitor pricing, product features, about pages, blog feeds, job boards)? Select all. Instead of 50 individual alerts, you get one consolidated digest scoped to exactly what you care about.
AI-generated summaries
The report synthesizes patterns across changes, identifying shifts in competitor messaging, changes in social proof metrics, trends in ad velocity, and pricing movements across the full set of monitored pages.
Visual diffs
Each change includes side-by-side screenshots showing the current state versus the previous state. No ambiguity about what actually changed. When a competitor quietly removes a pricing tier or adds a new enterprise CTA, you see it directly.
Scheduled delivery
Reports can be configured for daily automated delivery to everyone in a workspace. Your team gets a competitive digest in their inbox without anyone having to manually compile it.
Historical analysis
Custom date ranges let you pull reports across weeks or months of change data, useful for quarterly business reviews, board presentations, or identifying longer-term competitive trends that don't surface in weekly snapshots.
Multiple sharing and export formats
Reports are available in the dashboard and can be shared via link or email, exported as PDF, Excel, or CSV, or printed directly. Whether you need a polished deliverable for a client or raw data for analysis, the format is there.
Team discussion, built in
Each change entry in a report supports comments, reactions, and flagging. Your CI analyst can flag a competitor's pricing shift as urgent. Your product marketer can comment with context from a recent sales call. Instead of the intelligence living in a report and the discussion happening in Slack, both happen in one place. Hide the changes that don't warrant attention, and the report becomes a curated, annotated record of what your competitors did and what your team decided to do about it.
It's a monitoring tool with an intelligence and collaboration layer, scoped narrower than a full CI platform. That distinction matters.
The math on manual CI work
The ROI case for Reports isn't Reports vs. Klue. It's Reports vs. the labor cost of doing it manually.
A product marketer spending 2 hours per week compiling competitive updates from individual alerts spends 104 hours per year on manual synthesis. At a loaded cost of $75/hour, that's $7,800 in labor doing what Reports automates. A Visualping Business plan costs approximately $1,200/year. The savings are financial and cognitive. Every hour spent compiling alerts is an hour not spent analyzing the intelligence those alerts contain.
For agencies, the math is even more direct: 12 clients at 45 minutes of weekly compilation each equals 468 hours per year. We've seen agency teams using Reports cut that to review time only (roughly a third of the manual effort) while delivering a more consistent output to clients.
Honest positioning: what Visualping Reports is not
If you need sales battlecards integrated into Salesforce, buy Klue. If you need multi-channel intelligence across news, social media, regulatory filings, and patent databases, evaluate Crayon or Contify. If you need win-loss analysis pipelines, you need an enterprise CI platform and the analyst headcount to operate it.
Visualping Reports does not replace those capabilities. It replaces the manual work of aggregating website change alerts into a coherent picture of competitive activity, with built-in comments and flagging so your team can discuss findings directly in the report. For teams where web monitoring covers the majority of their CI needs, that's a significant portion of the value at a fraction of the cost.
For teams where it's not, where CI extends deeply into sales enablement, media monitoring, or analyst-driven research, Reports is a complement, not a substitute.
Reports vs. per-competitor monitoring tools
Some tools, like Competitors.app, price per competitor (approximately $9.90/month per competitor tracked). For a focused use case (2-3 competitors), that math works. At scale, it breaks down: ten competitors across multiple monitoring categories costs significantly more, and you're still limited to competitor websites.
Visualping's model is fundamentally different. You monitor pages, not competitors, and Reports aggregates everything in a workspace regardless of source. A single workspace can include competitor websites, regulatory pages, partner sites, industry publication pages, and your own properties. The report captures all of it.
This matters because competitive intelligence isn't only about direct competitors. Tracking a regulatory body's guidance page, a key partner's competitive pricing, or an industry analyst's published rankings are all legitimate CI activities. Per-competitor pricing models make that breadth expensive. Page-based monitoring with workspace-level aggregation does not.
Who this is for
The solo CI analyst. You own competitive intelligence alongside product marketing, content strategy, or sales enablement. You don't have time to manually compile weekly competitive updates. You need a report you can forward to stakeholders that looks like it took hours to produce but actually runs on autopilot.
The product marketing team. Three to five people tracking competitor positioning, feature launches, and messaging changes. You need a shared view of competitive activity that keeps the whole team aligned without a standing meeting to review individual alerts.
The strategy consultant. You monitor competitive landscapes for multiple clients. Each client gets a workspace, each workspace generates its own report. You deliver consolidated competitive digests as part of your advisory retainer without building them manually from screenshots and bookmarks.
The startup founder. You're tracking five to ten competitors yourself, and your "CI process" is a browser tab group you check when you remember. You need something that runs in the background and surfaces what matters without requiring a workflow you'll never maintain.
See 5 detailed workflows built on Reports for step-by-step setup guides for each of these personas.
Go deeper: What Is Competitive Intelligence? | Compliance Monitoring Software Solutions
Getting started
The setup is measured in minutes, not months.
- Create a workspace scoped to your competitive landscape, or to a specific client, product line, or market segment.
- Add monitoring jobs for the pages you care about: competitor homepages, pricing pages, product feature pages, careers pages, blog indexes, landing pages. Visualping handles the change detection.
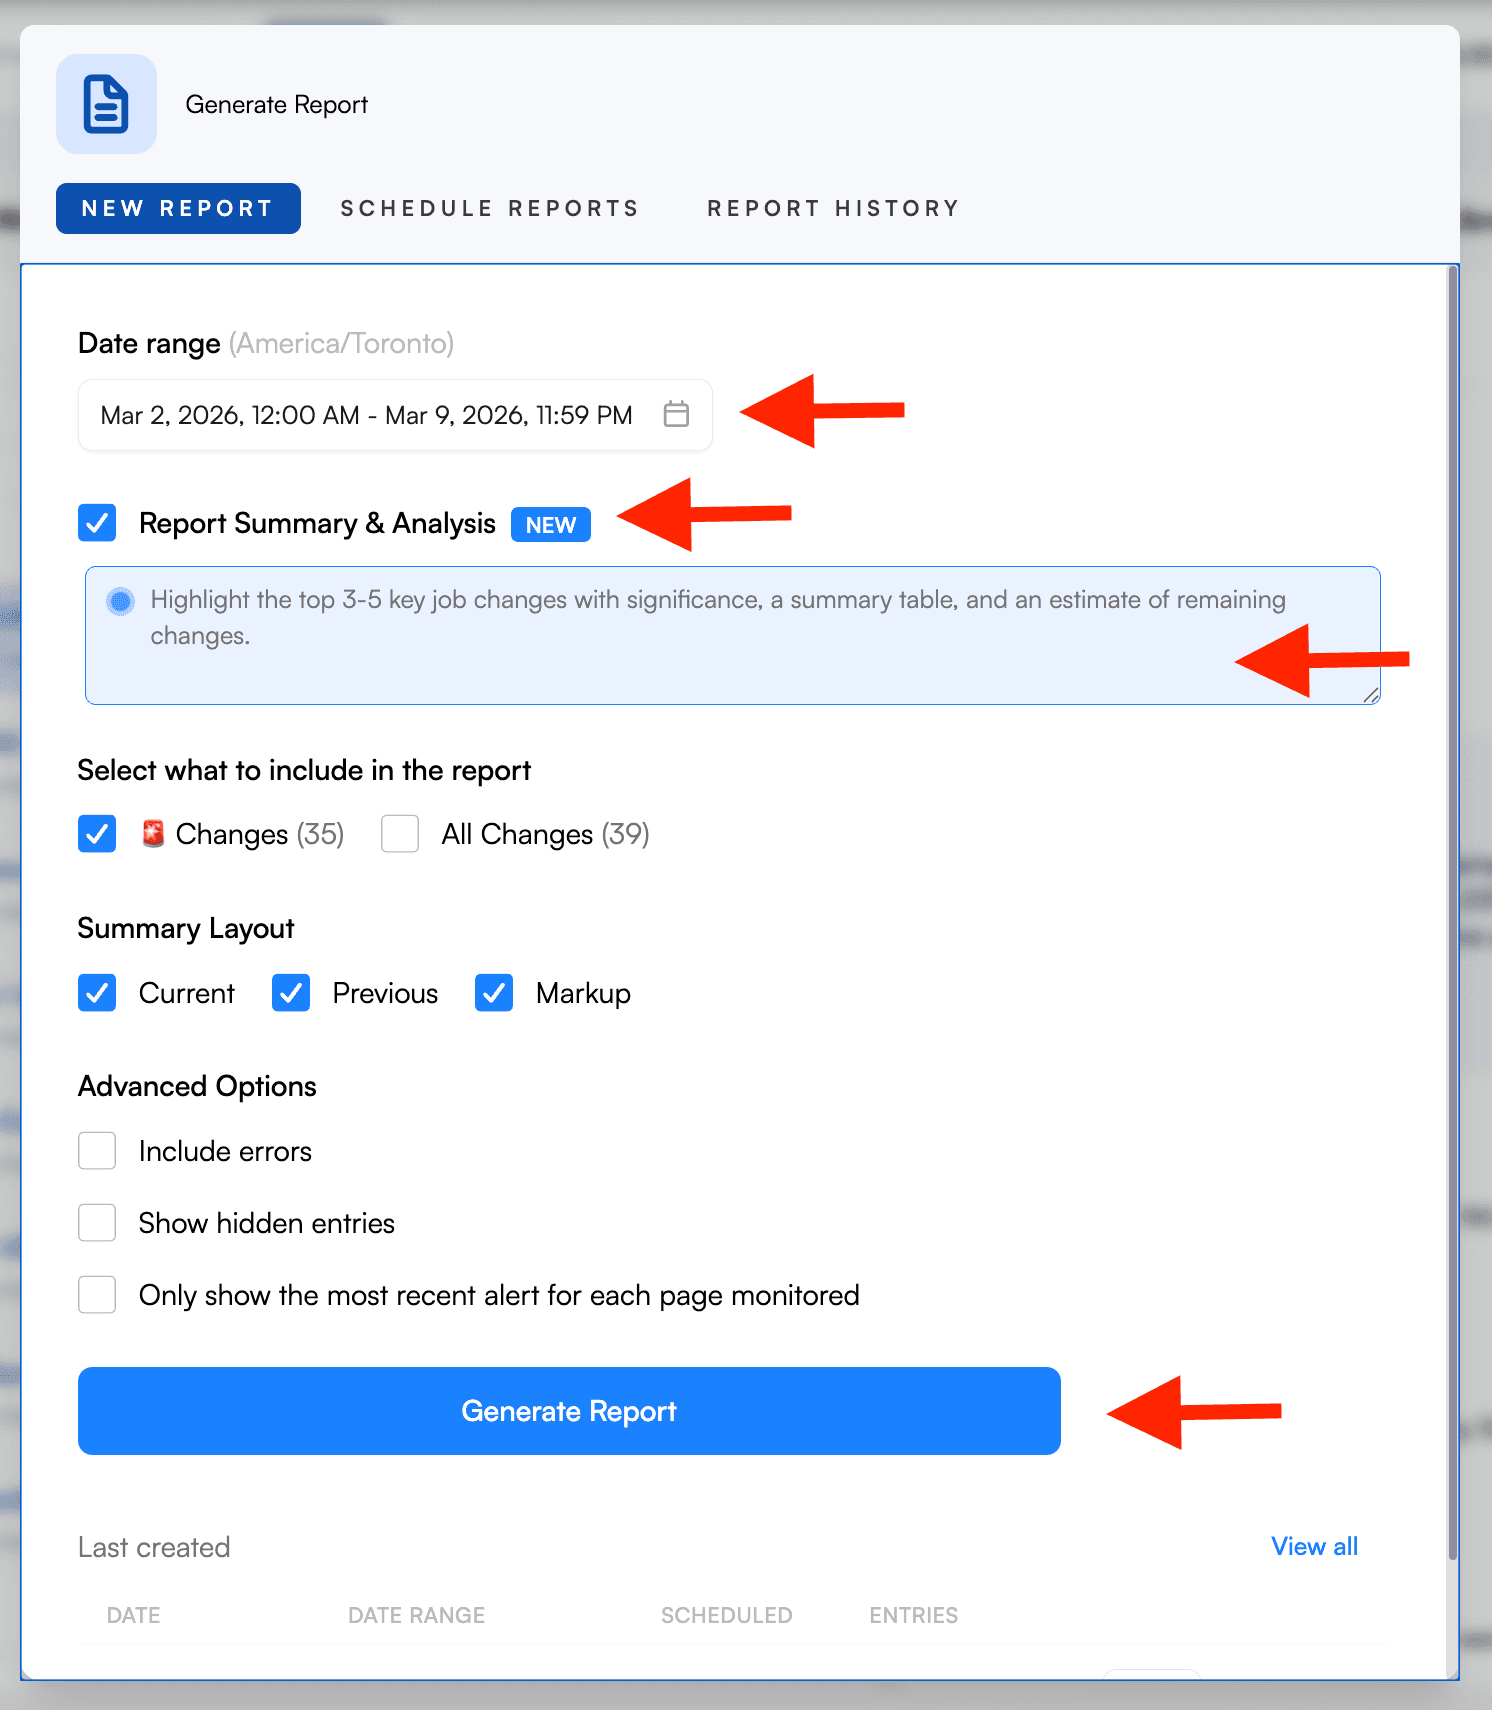
- Generate a Report. Select the jobs you want to include (checkboxes in your job list), pick your date range, toggle on "Report Summary & Analysis," and hit Generate. Reports aggregates all detected changes with AI summaries, visual diffs, and importance flags across your selected jobs.
- Schedule delivery. Set daily automated reports so your team gets a competitive digest without anyone pressing a button.
The first report you generate will show you whether this approach fits your workflow. If your CI needs are primarily web-driven, it likely covers more ground than you'd expect from a monitoring tool. For detailed setup instructions, see our step-by-step walkthrough guide.
Frequently asked questions
Is Visualping Reports a replacement for Klue or Crayon? No. Klue and Crayon are enterprise CI platforms with battlecards, CRM integrations, and win-loss analysis. Visualping Reports is a monitoring tool with an intelligence layer. It aggregates website change data into AI-summarized briefings. For teams whose CI needs are primarily web-driven, Reports covers the majority of the workflow at a fraction of the cost. For teams that need full enterprise CI capabilities, Reports can complement a Klue or Crayon deployment by covering website monitoring.
How much does competitive intelligence software cost? The range is wide. Individual page monitoring agents (also known as website monitoring tools) cost $0-50/month. Visualping Reports is included free with Business plans (approximately $100/month). Enterprise CI platforms like Klue and Crayon start at $16,000-$40,000+ per year and typically require dedicated CI headcount to operate.
Can I use Visualping for competitive intelligence? Yes. Visualping monitors website changes: pricing pages, feature pages, job boards, blog posts, landing pages, and more. Reports aggregates those changes into scheduled briefings with AI summaries that identify patterns across all monitored pages. This covers the web-monitoring component of competitive intelligence, which for many mid-market teams represents the majority of their CI workflow.
How long does it take to set up competitive intelligence monitoring? With Visualping, setup takes minutes. Add the pages you want to monitor, generate a report, and optionally set a recurring schedule. Enterprise CI platforms typically require 3-6 months of onboarding, data integration, and configuration.
Does Visualping Reports include AI analysis? Yes. Every report includes an AI-generated summary at the top that synthesizes patterns across all detected changes, identifying shifts in competitor messaging, pricing movements, content strategy changes, and other trends. Individual change entries also include AI-generated descriptions of what specifically changed on each page.
Try Visualping Reports
If your competitive intelligence needs have outgrown individual change alerts but haven't reached the scale that justifies a $16K+ enterprise platform, Reports fills that gap.
Set up a workspace, add the competitor pages you're already checking manually, and generate your first report. You'll know within minutes whether it fits.
[Open Reports in your workspace →] Included free with all Business plans.
Want to monitor web changes that impact your business?
Sign up with Visualping to get alerted of important updates from anywhere online.
The Visualping Team
The Visualping Team is the content and product marketing group at Visualping, a leading platform for website change detection and competitive intelligence. We write about automation, web monitoring, and tools that help businesses stay ahead.