Top 10 Investment Research Tools in 2026
By Emily Fenton
Updated April 21, 2026

The right investment research tools determine how fast you can move on a thesis. Bloomberg and FactSet have been standard issue for decades, but the market has changed: AI-powered search platforms like AlphaSense now surface earnings call insights in seconds, and page monitoring agents (also known as website monitoring tools) alert you the moment a company updates its IR page or files a new SEC document.
This guide reviews 10 investment research tools that cover the full research workflow, from fundamental data terminals to alternative data platforms and real-time monitoring. Each review includes what the tool does best, its core features, and where it fits in a research stack. If you run a fundamental research practice, the AI-powered search and monitoring tools on this list have likely outpaced your current workflow.
In a sample of nearly 46,000 active financial page monitors on Visualping, over 43% check every hour or more frequently. That pace reflects how investment researchers now work: checking for changes manually is no longer viable at scale. The tools below reflect that reality.
The short list: Bloomberg Terminal and FactSet for fundamental data. AlphaSense for AI-powered filing search. Morningstar Direct for fund selection. Koyfin for free-tier charting. Nasdaq Data Link for quant data feeds. LSEG Workspace and S&P Capital IQ as Bloomberg alternatives at different price points. Aladdin for institutional risk. Visualping for real-time monitoring on IR pages, SEC filings, and competitor pricing that terminals miss.
How We Evaluated These Investment Research Tools
We selected these 10 platforms based on four criteria:
- Coverage depth: How much of the investable universe does the tool cover? Does it span equities, fixed income, alternatives, and macroeconomic data?
- Research workflow fit: Does it serve fundamental analysts, quantitative researchers, or both? Can it integrate into existing workflows via API or Excel?
- Real-time capability: Can it deliver data and alerts fast enough for time-sensitive decisions like earnings reactions or regulatory filings?
- Adoption by investment professionals: Is the tool actually used by fund managers, analysts, and research teams, or is it primarily a retail product?
We excluded platforms used primarily by retail investors, even where the data quality is strong. Pricing context is included where publicly available, though enterprise pricing varies by seat count and data packages.
Quick Comparison: Investment Research Tools at a Glance
| Tool | Best For | Data Type | Real-Time | Starting Price |
|---|---|---|---|---|
| Bloomberg Terminal | Full-spectrum research + trading | Market data, news, analytics | Yes | ~$24,000/yr |
| FactSet | Fundamental analysis + modeling | Financial data, estimates | Yes | ~$12,000/yr |
| Morningstar Direct | Fund selection + asset allocation | Fund data, performance | Yes | Custom |
| AlphaSense | AI-powered document search | Filings, transcripts, reports | Yes | ~$10,000/yr |
| Visualping | Website change monitoring for IR/SEC/pricing pages | Web change alerts | Yes (2-min checks) | Free / $10/mo |
| LSEG Workspace | Global market data + analytics | Market data, news, estimates | Yes | Custom |
| Koyfin | Visual financial data for independent research | Market data, screening | Yes | Free / $39/mo |
| Nasdaq Data Link | Alternative + quantitative data | Alt data, macro, commodities | API | Free / Custom |
| Aladdin by BlackRock | Institutional risk + portfolio management | Risk models, portfolio data | Yes | Enterprise |
| S&P Capital IQ | Company screening + credit analysis | Financials, M&A, credit | Yes | ~$15,000/yr |
Bloomberg Terminal: Full-Spectrum Market Data and Trading
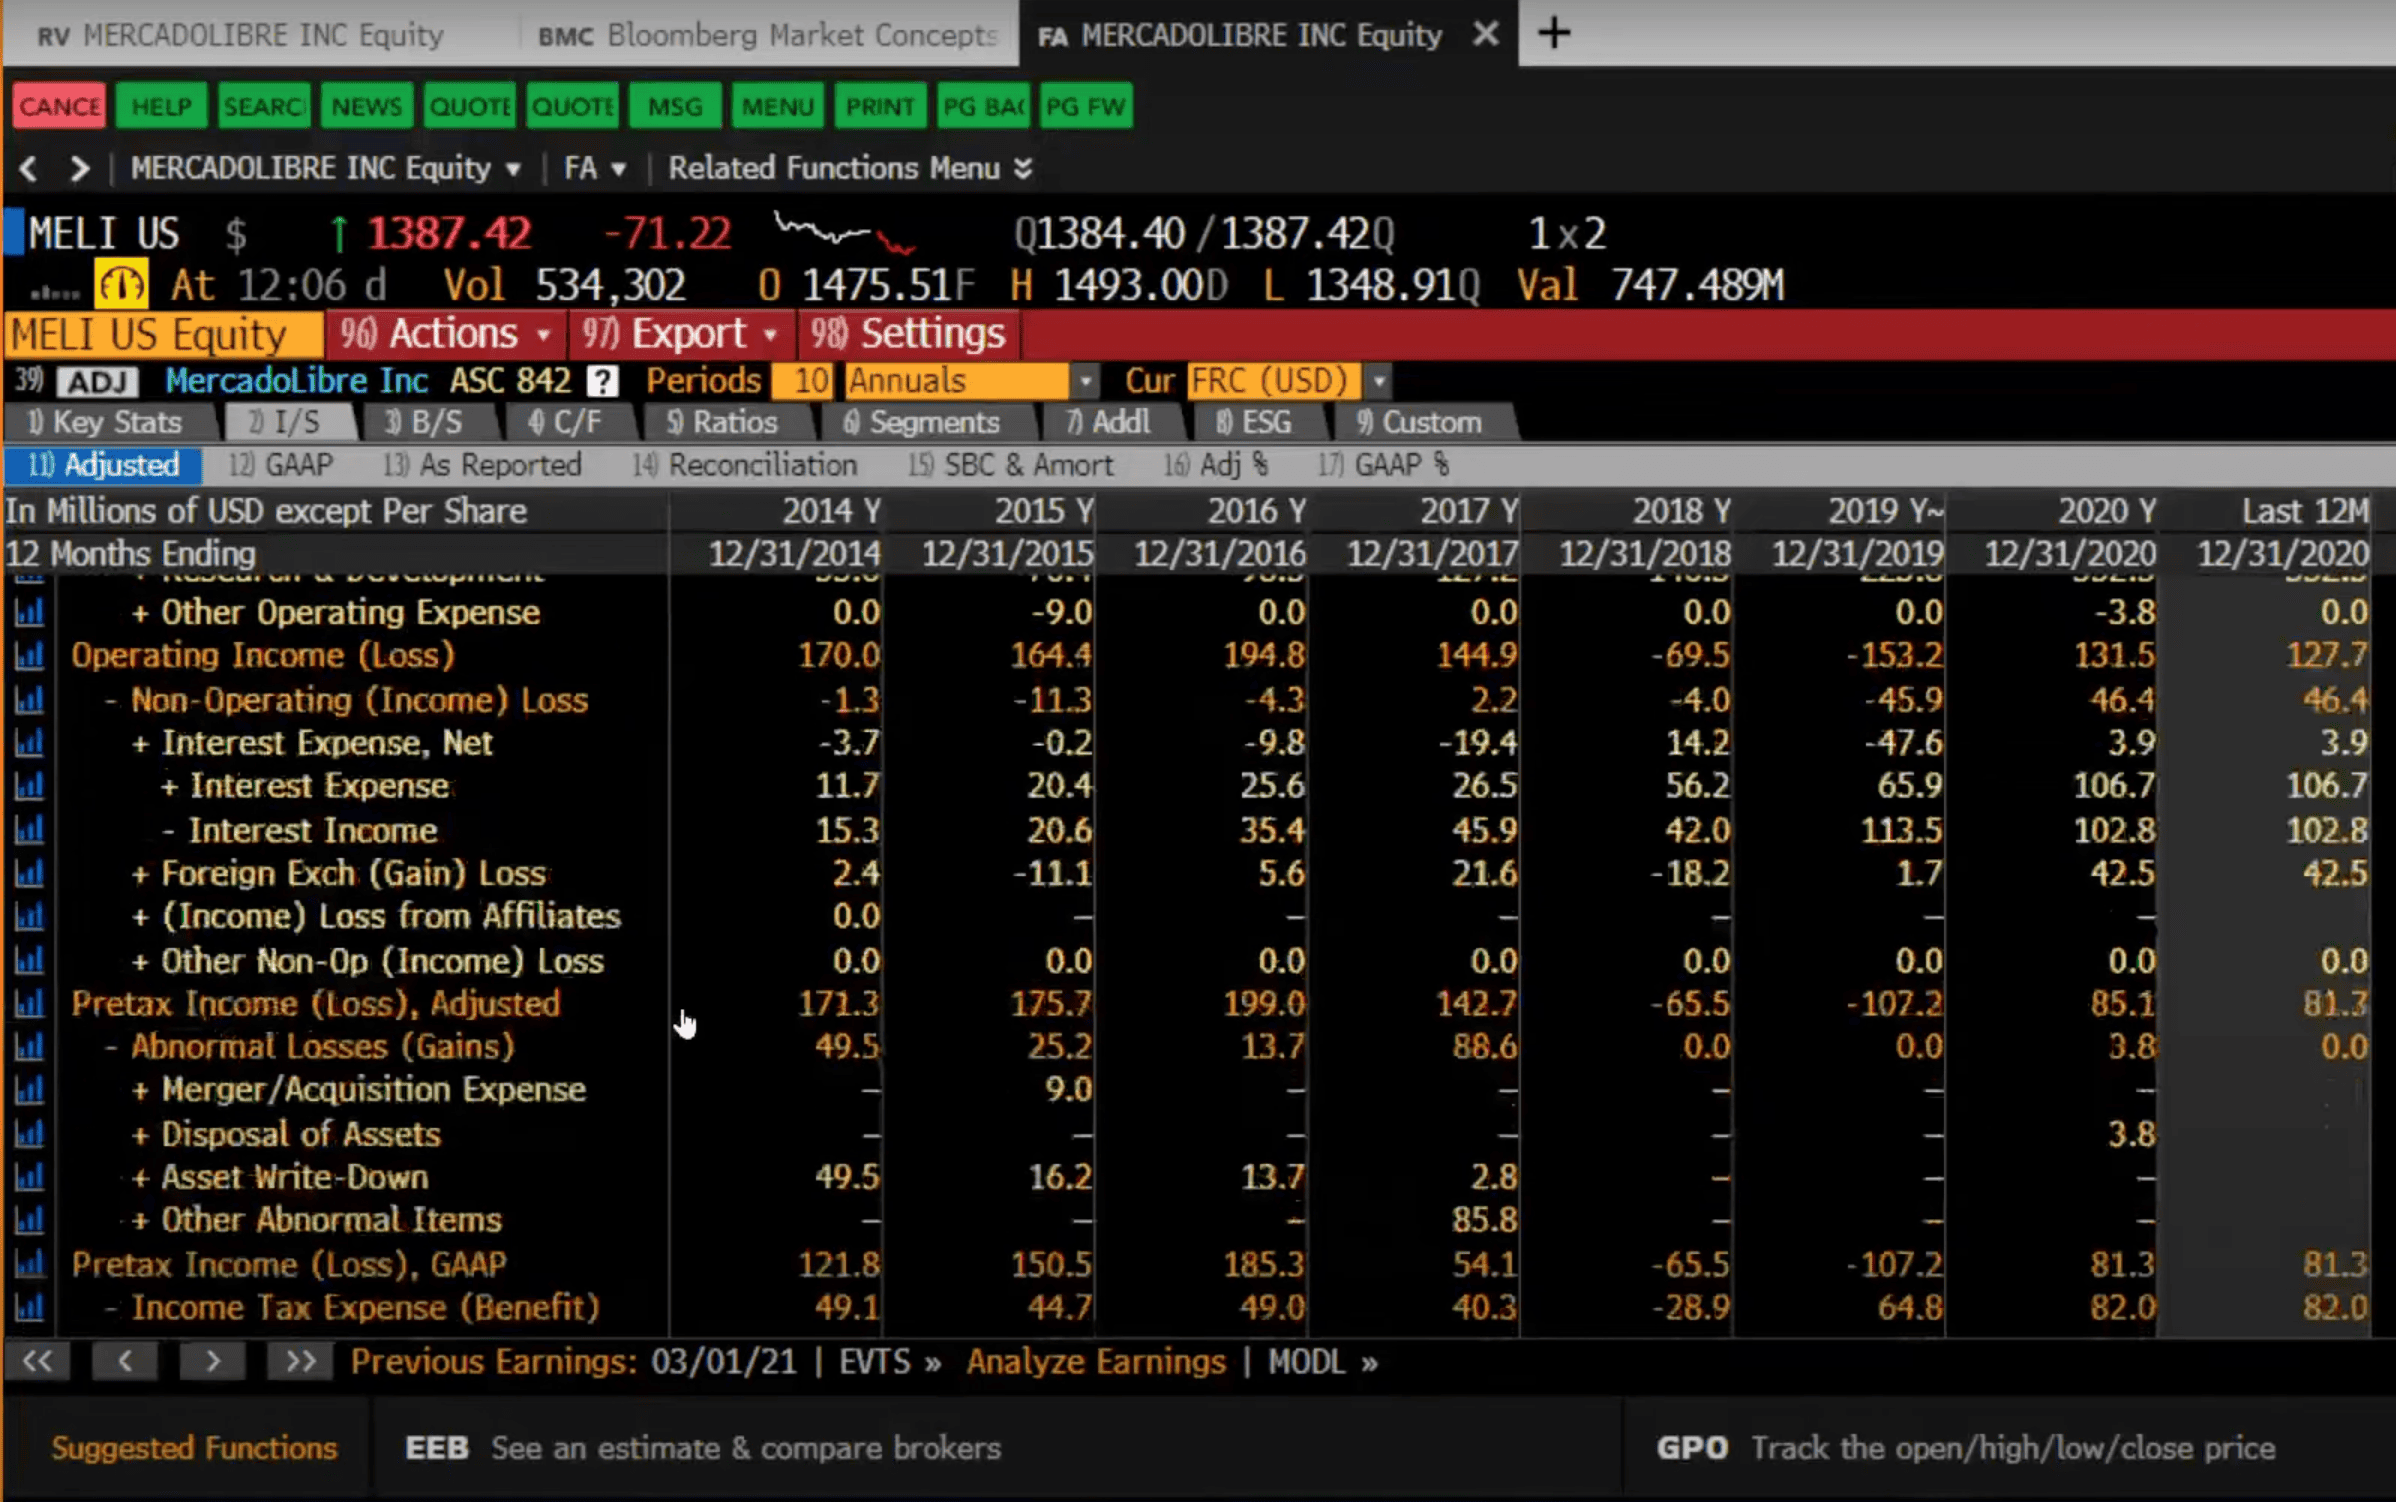
The Bloomberg Terminal remains the default research platform for institutional investors. It combines real-time market data across every asset class with proprietary news, analytics, messaging, and trading execution in a single interface. Over 325,000 professionals use it worldwide.
What makes Bloomberg difficult to replace is the depth of its data universe combined with the Bloomberg Messaging network (IB). The terminal functions as both a research tool and a communication hub where analysts, traders, and salespeople interact directly.
Best For
Portfolio managers and traders who need a single platform for market data, news, analytics, execution, and professional communication. Bloomberg is the default in sell-side research, trading desks, and large buy-side firms.
Top Features
- Real-time market data and news: Unmatched coverage across equities, fixed income, currencies, commodities, and derivatives, with exclusive Bloomberg News reporting.
- Financial modeling and charting: Bloomberg Excel Add-In (BDH, BDP functions) allows custom analytics and reporting directly in spreadsheets.
- Bloomberg Messaging (IB): Direct communication with industry professionals, including custom alerts and notifications for market events.
Limitations
The cost ($24,000+/year per terminal) puts Bloomberg out of reach for smaller firms and independent researchers. The interface has a steep learning curve, and many users report paying for capabilities they never touch. See popular Bloomberg terminal alternatives for lower-cost options.
FactSet: Fundamental Analysis and Financial Modeling
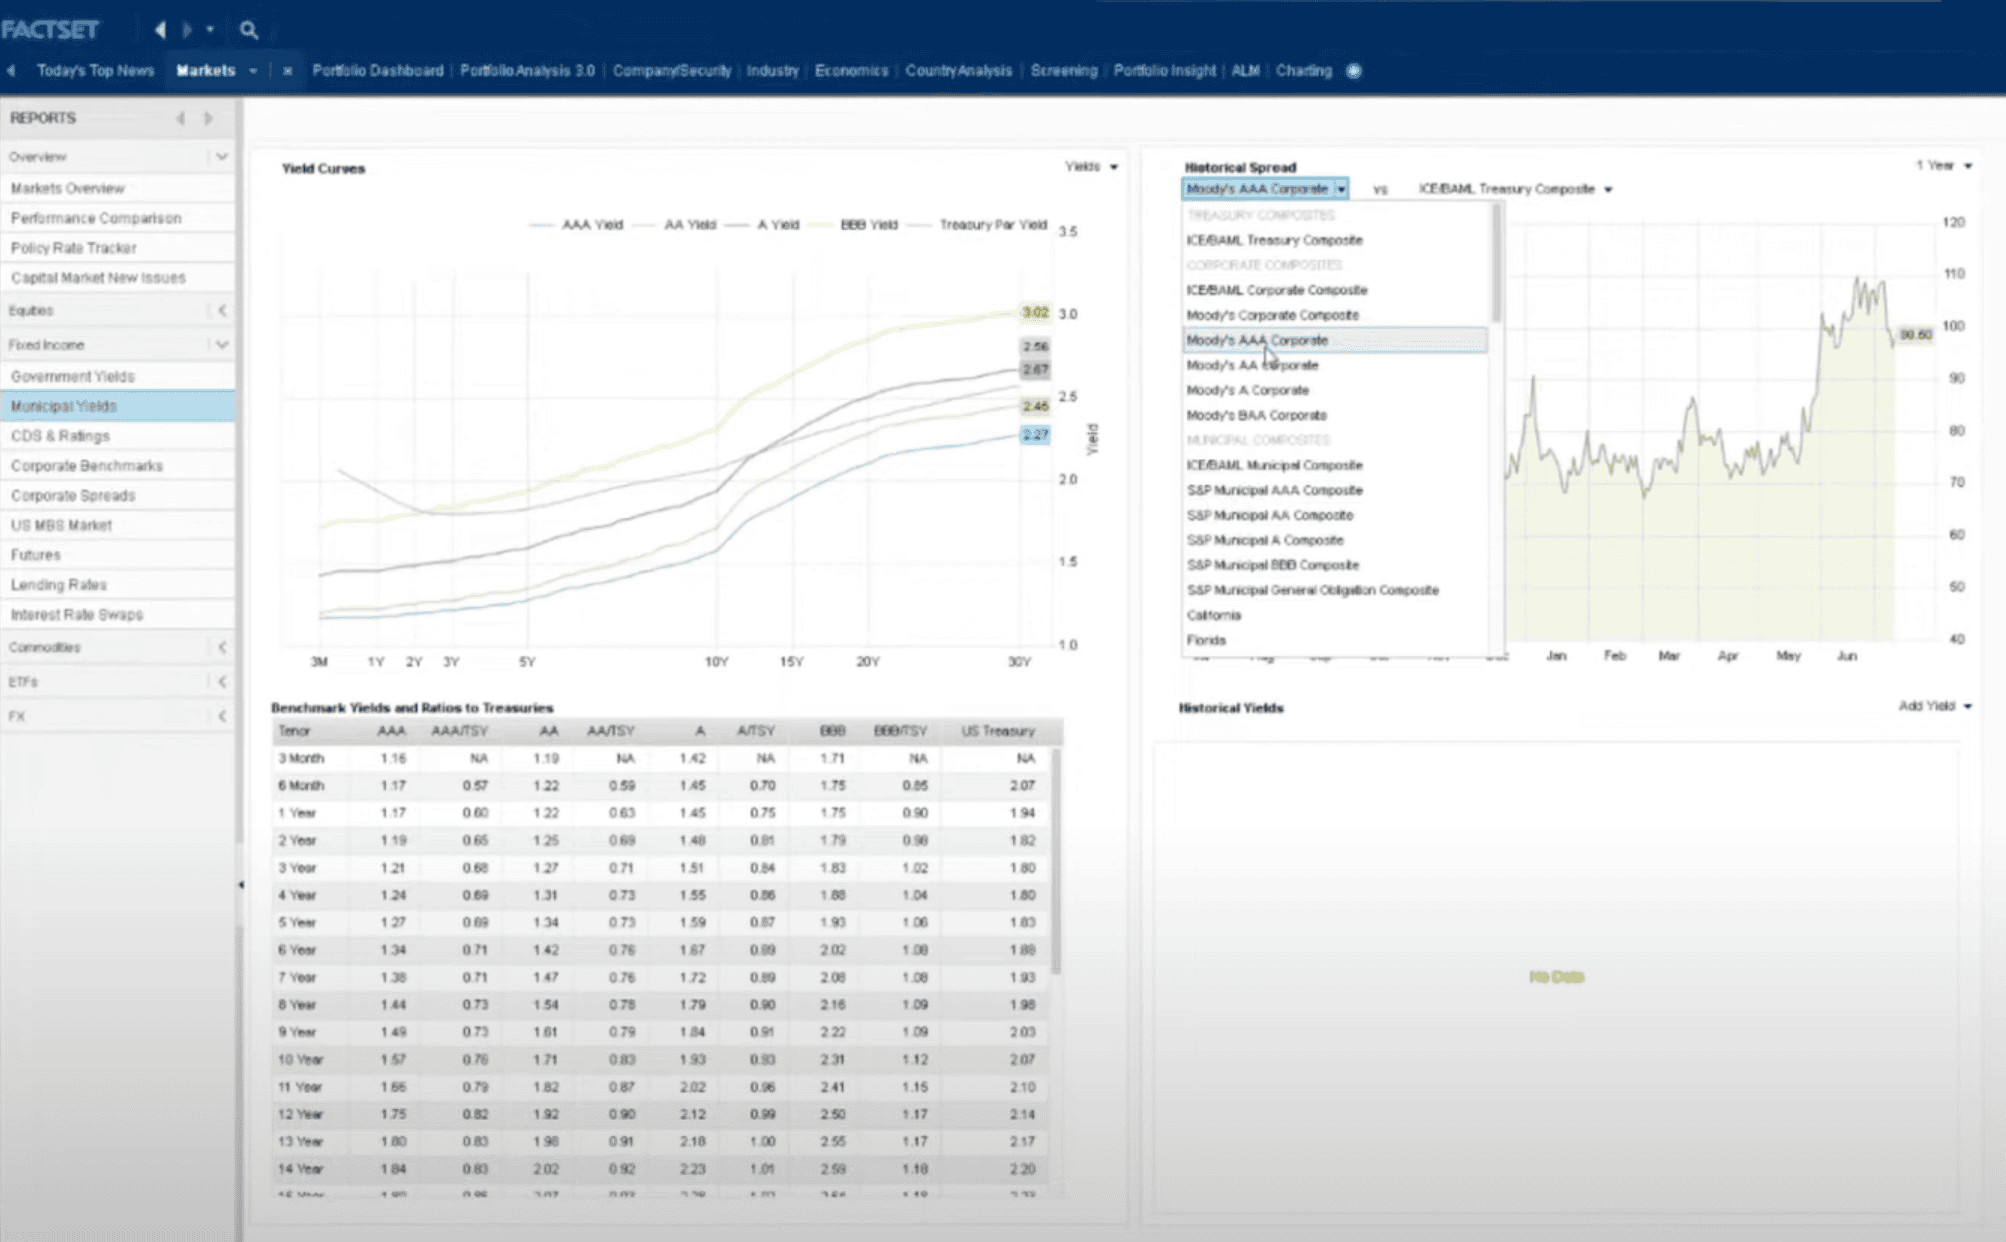
FactSet is a financial data and analytics platform that competes with Bloomberg on fundamental research depth while offering stronger customization for quantitative workflows. It integrates data from hundreds of sources and provides tools for financial modeling, screening, portfolio management, and risk analysis.
Where FactSet differentiates is in its flexible data delivery. Analysts can pull data via API, Excel, or the desktop application, and the platform's screening tools help identify investment opportunities across asset classes faster than manual research.
Best For
Fundamental analysts, equity researchers, and portfolio managers who spend their day building models, running screens, and analyzing company financials. FactSet is particularly strong at buy-side firms that need customizable research workflows.
Top Features
- Integrated financial data and analytics: Unified access to global market data, financial statements, earnings estimates, and economic indicators with customizable data feeds.
- Advanced screening tools: Search and filter investment opportunities by specific financial criteria across equity, fixed income, and alternative assets.
- Portfolio and risk management: Performance tracking, risk metrics, and asset allocation optimization using proprietary risk models and stress testing.
Morningstar Direct: Fund Selection and Performance Attribution
Morningstar Direct is the institutional arm of Morningstar's research platform. While Morningstar.com serves retail investors, Direct provides the depth that fund selectors, asset allocators, and multi-asset portfolio managers need: comprehensive data on mutual funds, ETFs, equities, and alternatives, plus Morningstar's proprietary analyst ratings and quantitative scores.
The platform stands out for performance attribution. Analysts can decompose returns by factor, sector, geography, and manager decision to understand exactly what drove performance, an essential capability for fund-of-funds managers and institutional allocators.
Best For
Portfolio managers, fund selectors, and research analysts at asset management firms, wealth advisors, and pension funds. Strongest for teams focused on fund selection, asset allocation, and performance attribution.
Top Features
- Deep fund data: Coverage spans mutual funds, ETFs, hedge funds, and separately managed accounts, all scored with Morningstar's proprietary ratings.
- Performance attribution: Break down portfolio performance by risk-adjusted returns, factor exposure, and manager skill.
- Investment screening: Filter investment opportunities across a wide range of financial metrics and qualitative factors, including Morningstar's analyst and quantitative ratings.
AlphaSense: AI-Powered Document Search for Analysts
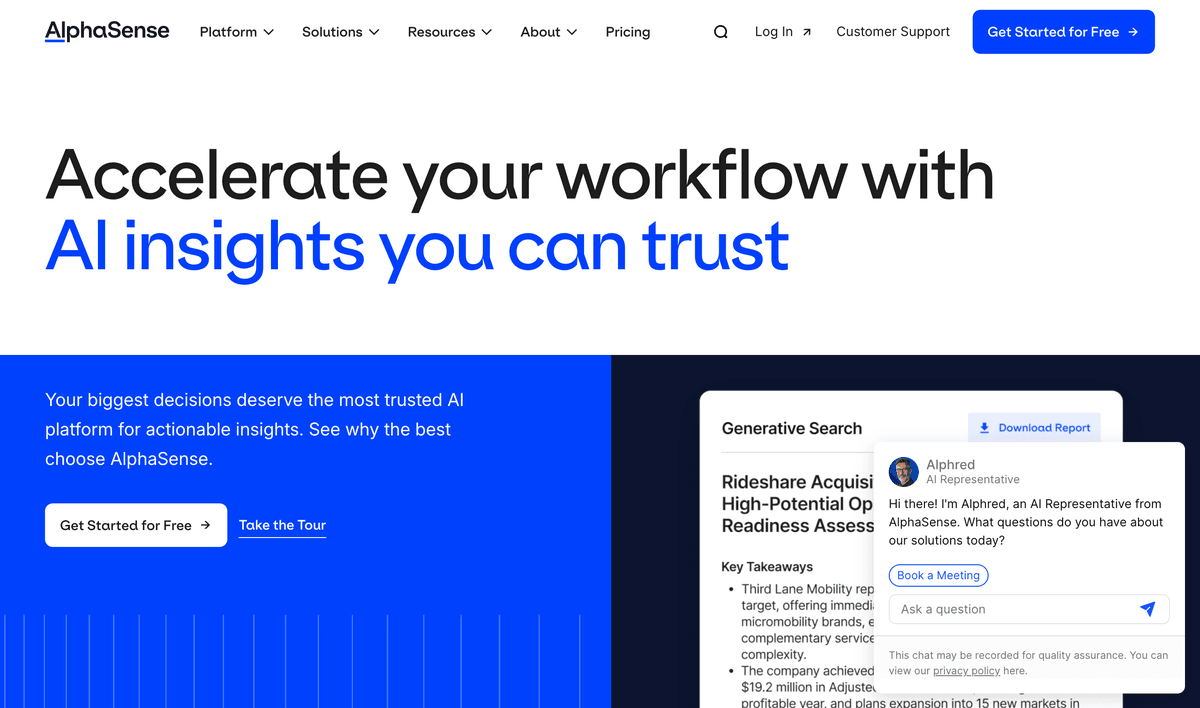
AlphaSense uses AI and natural language processing to search across earnings call transcripts, SEC filings, broker research, news, and trade journals. Rather than reading through hundreds of pages of filings manually, analysts type a question and get relevant passages surfaced instantly with context.
AlphaSense is now standard at many multi-manager platforms and fundamental equity shops, particularly among researchers and competitive intelligence teams who spend hours on document review. AlphaSense's Smart Synonyms feature understands financial terminology, so searching for "margin pressure" also surfaces mentions of "margin compression," "profitability headwinds," and similar concepts.
Best For
Fundamental equity analysts and sector specialists who need to search large document sets quickly. Particularly valuable during earnings season, when 150+ S&P 500 companies can report in a single week, and for due diligence on unfamiliar companies.
Top Features
- AI-powered document search: Natural language search across earnings transcripts, SEC filings (via EDGAR), broker research, and news with Smart Synonyms.
- Sentiment analysis: Track how companies discuss specific topics across quarters to identify narrative shifts before they show up in financials.
- Expert call transcripts: Access to thousands of expert network call transcripts for primary research insights.
Visualping: Real-Time Web Monitoring for IR, SEC, and Pricing Pages
Disclosure: Visualping is our product. We included it because portfolio managers we work with pair it with their research platforms to catch the moment a company updates its IR page, changes pricing, or files a new SEC document. For fundamental equity research, Bloomberg Terminal and FactSet cover far more of the workflow. For alternative data, Nasdaq Data Link and Koyfin. Visualping fills the monitoring gap: the alert that something changed before you read about it in a research note. Each tool is reviewed in the same format below.
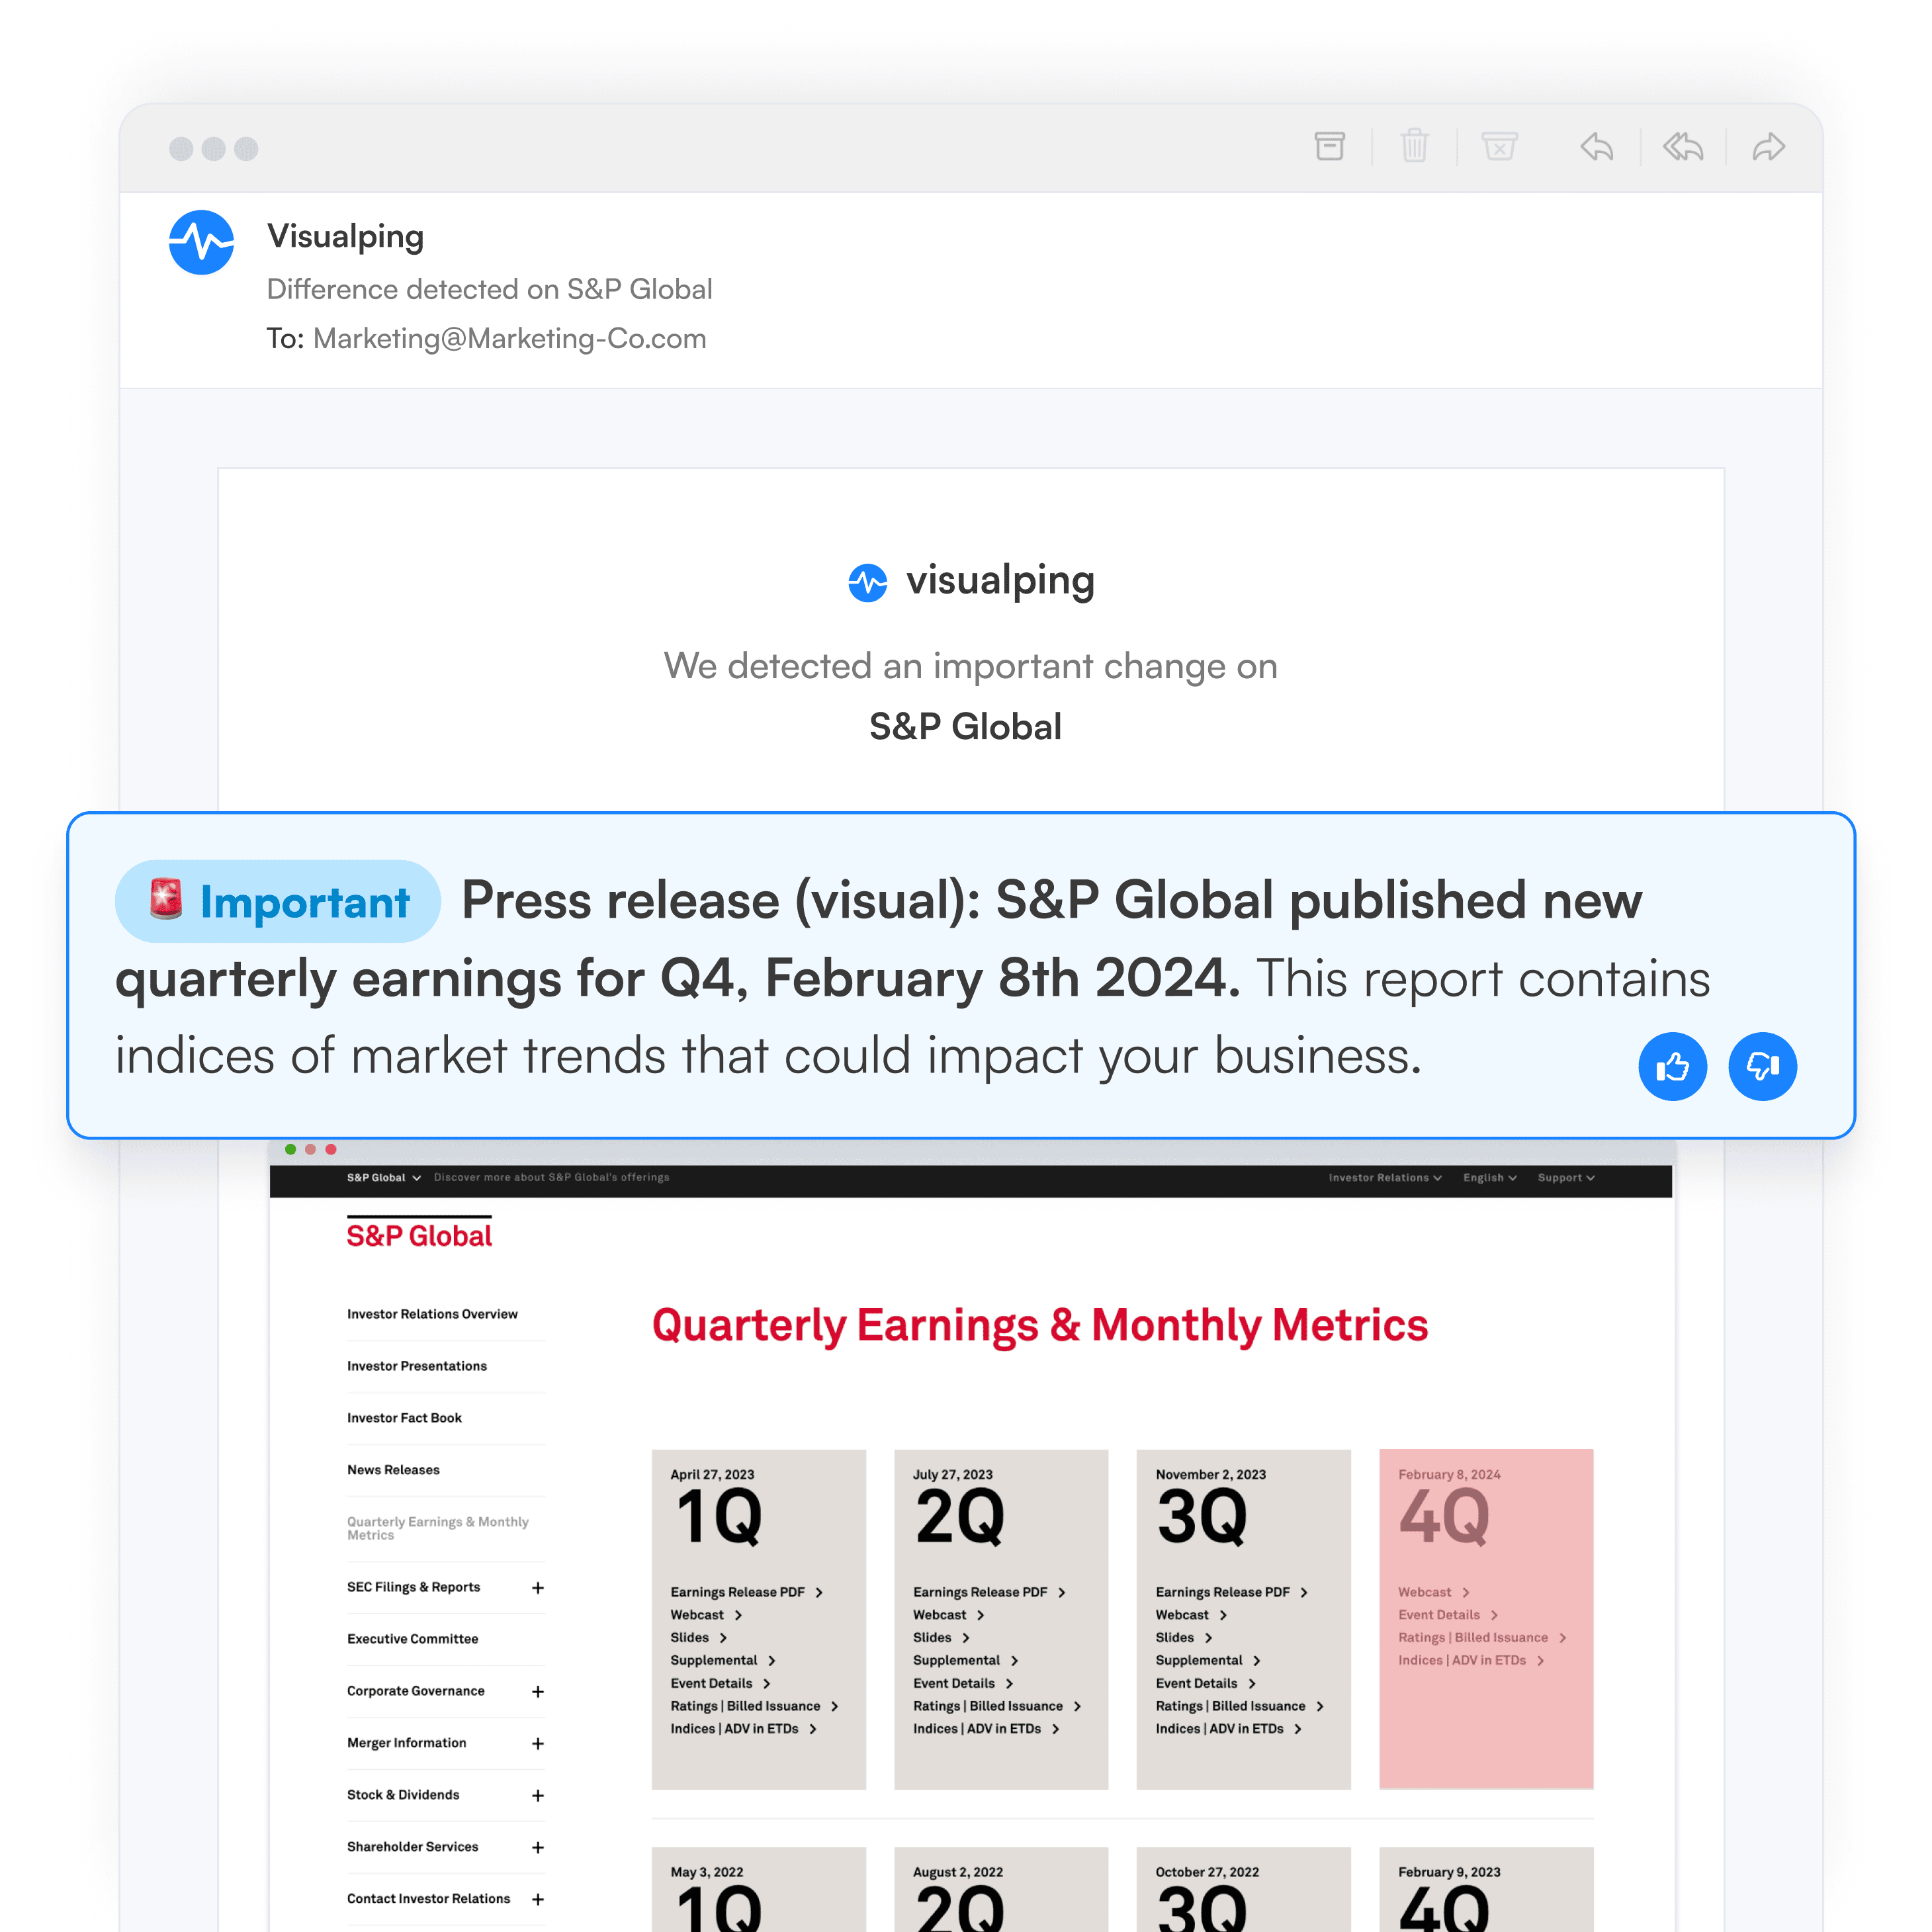
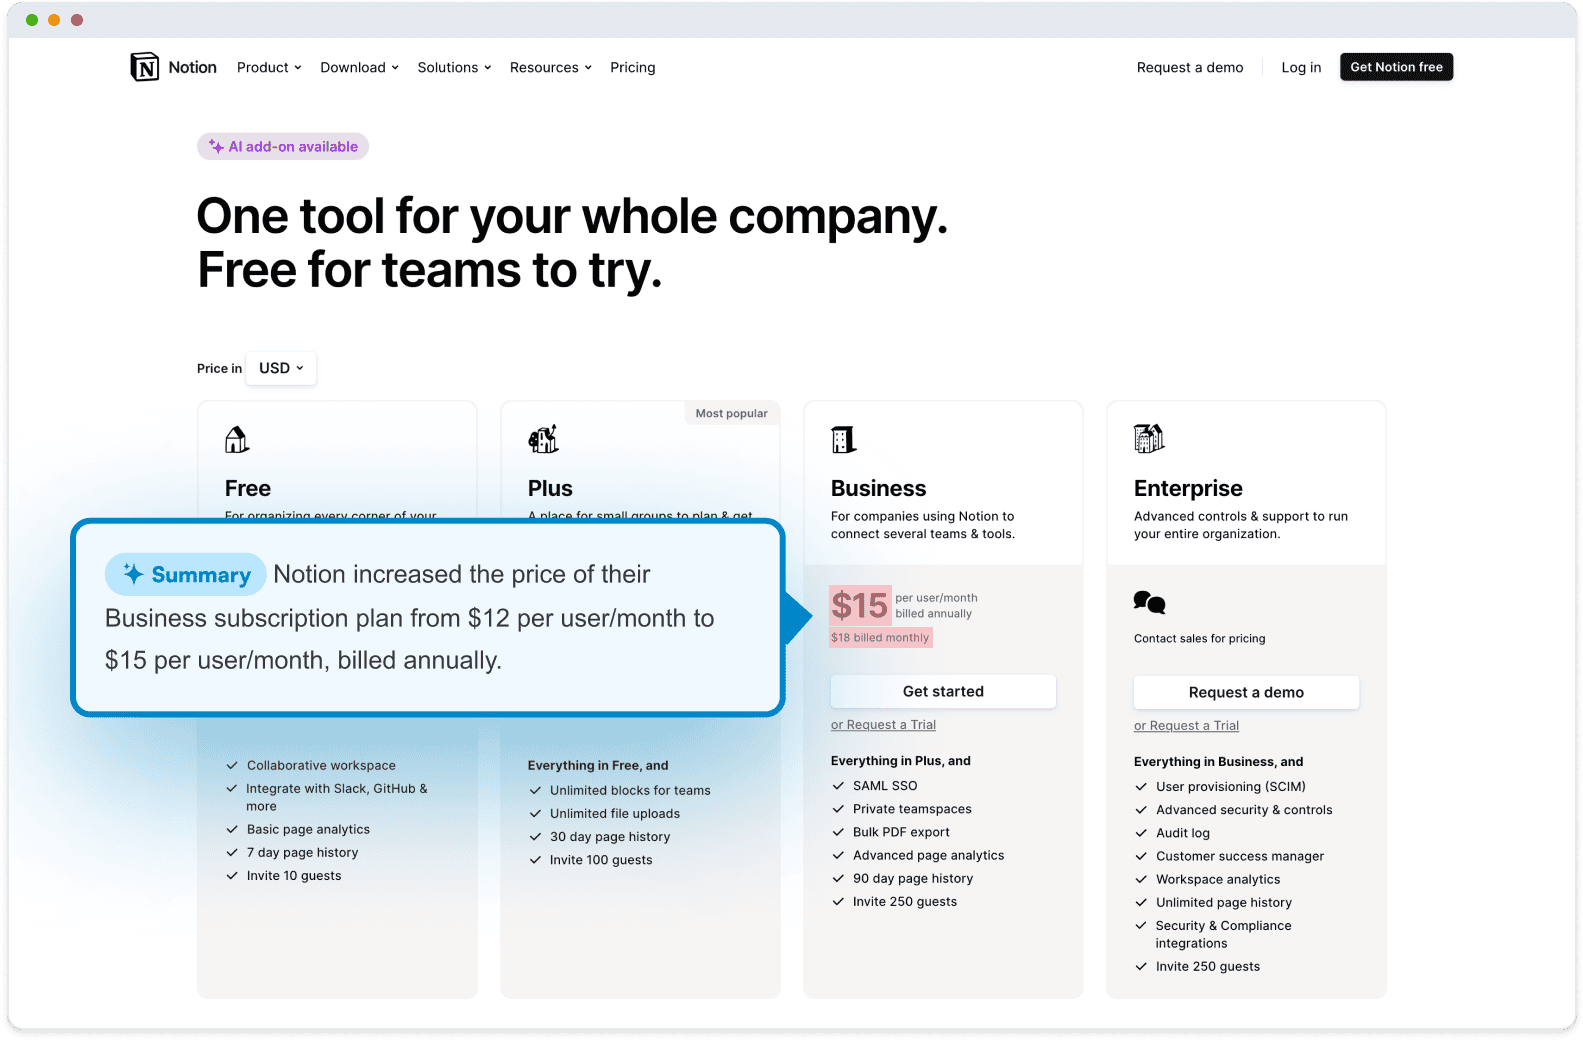
Visualping is a page monitoring agent that tracks updates to any public web page and sends alerts when something changes. For investment research teams, this means automated surveillance on IR pages, SEC filings, competitor pricing, regulatory announcements, and any web-published data relevant to an investment thesis.
Investor relations pages account for over a third of all financial page monitors in a sample of 46,000 on the platform, more than SEC.gov, Bloomberg, and Morningstar pages combined. For fund managers, the IR page is the primary watchtower.
When a change is detected, you get an alert that includes an AI-generated summary of the change, a screenshot with changes highlighted, and a binary IMPORTANT flag that distinguishes material updates from formatting noise.
Nearly two-thirds of financial page monitors in the same sample are run by business teams, not individuals, suggesting that investment research monitoring is an organizational workflow, not just a personal habit.
Best For
Researchers, analysts, and fund managers looking to supplement their market research with real-time web monitoring. Particularly compatible with fundamental analysis and event-driven investing strategies where timing matters: the first team to notice a pricing change, regulatory filing, or product update has a material advantage.
Top Features
- Limitless content scope: Monitor any public web source for updates. Track the specific pages key to your investment thesis that no terminal covers.
- Real-time alerts: Get notified of a change as quickly as two minutes after it occurs online. Over 100,000 users have selected stock and investment tracking as their primary use case.
- AI-powered filtering: Only get notified of updates that match your custom criteria, such as certain keywords or financial data, so you skip irrelevant formatting changes.
- Data integrations: Visualping extracts data from web pages as information changes, supporting direct integration with your models via API and webhooks.
Limitations
Visualping monitors web pages, not proprietary databases or terminal feeds. It complements tools like Bloomberg and FactSet rather than replacing them. For structured financial data (earnings estimates, financial statements, pricing feeds), you still need a data terminal.
LSEG Workspace: Global Market Data and Fixed-Income Research
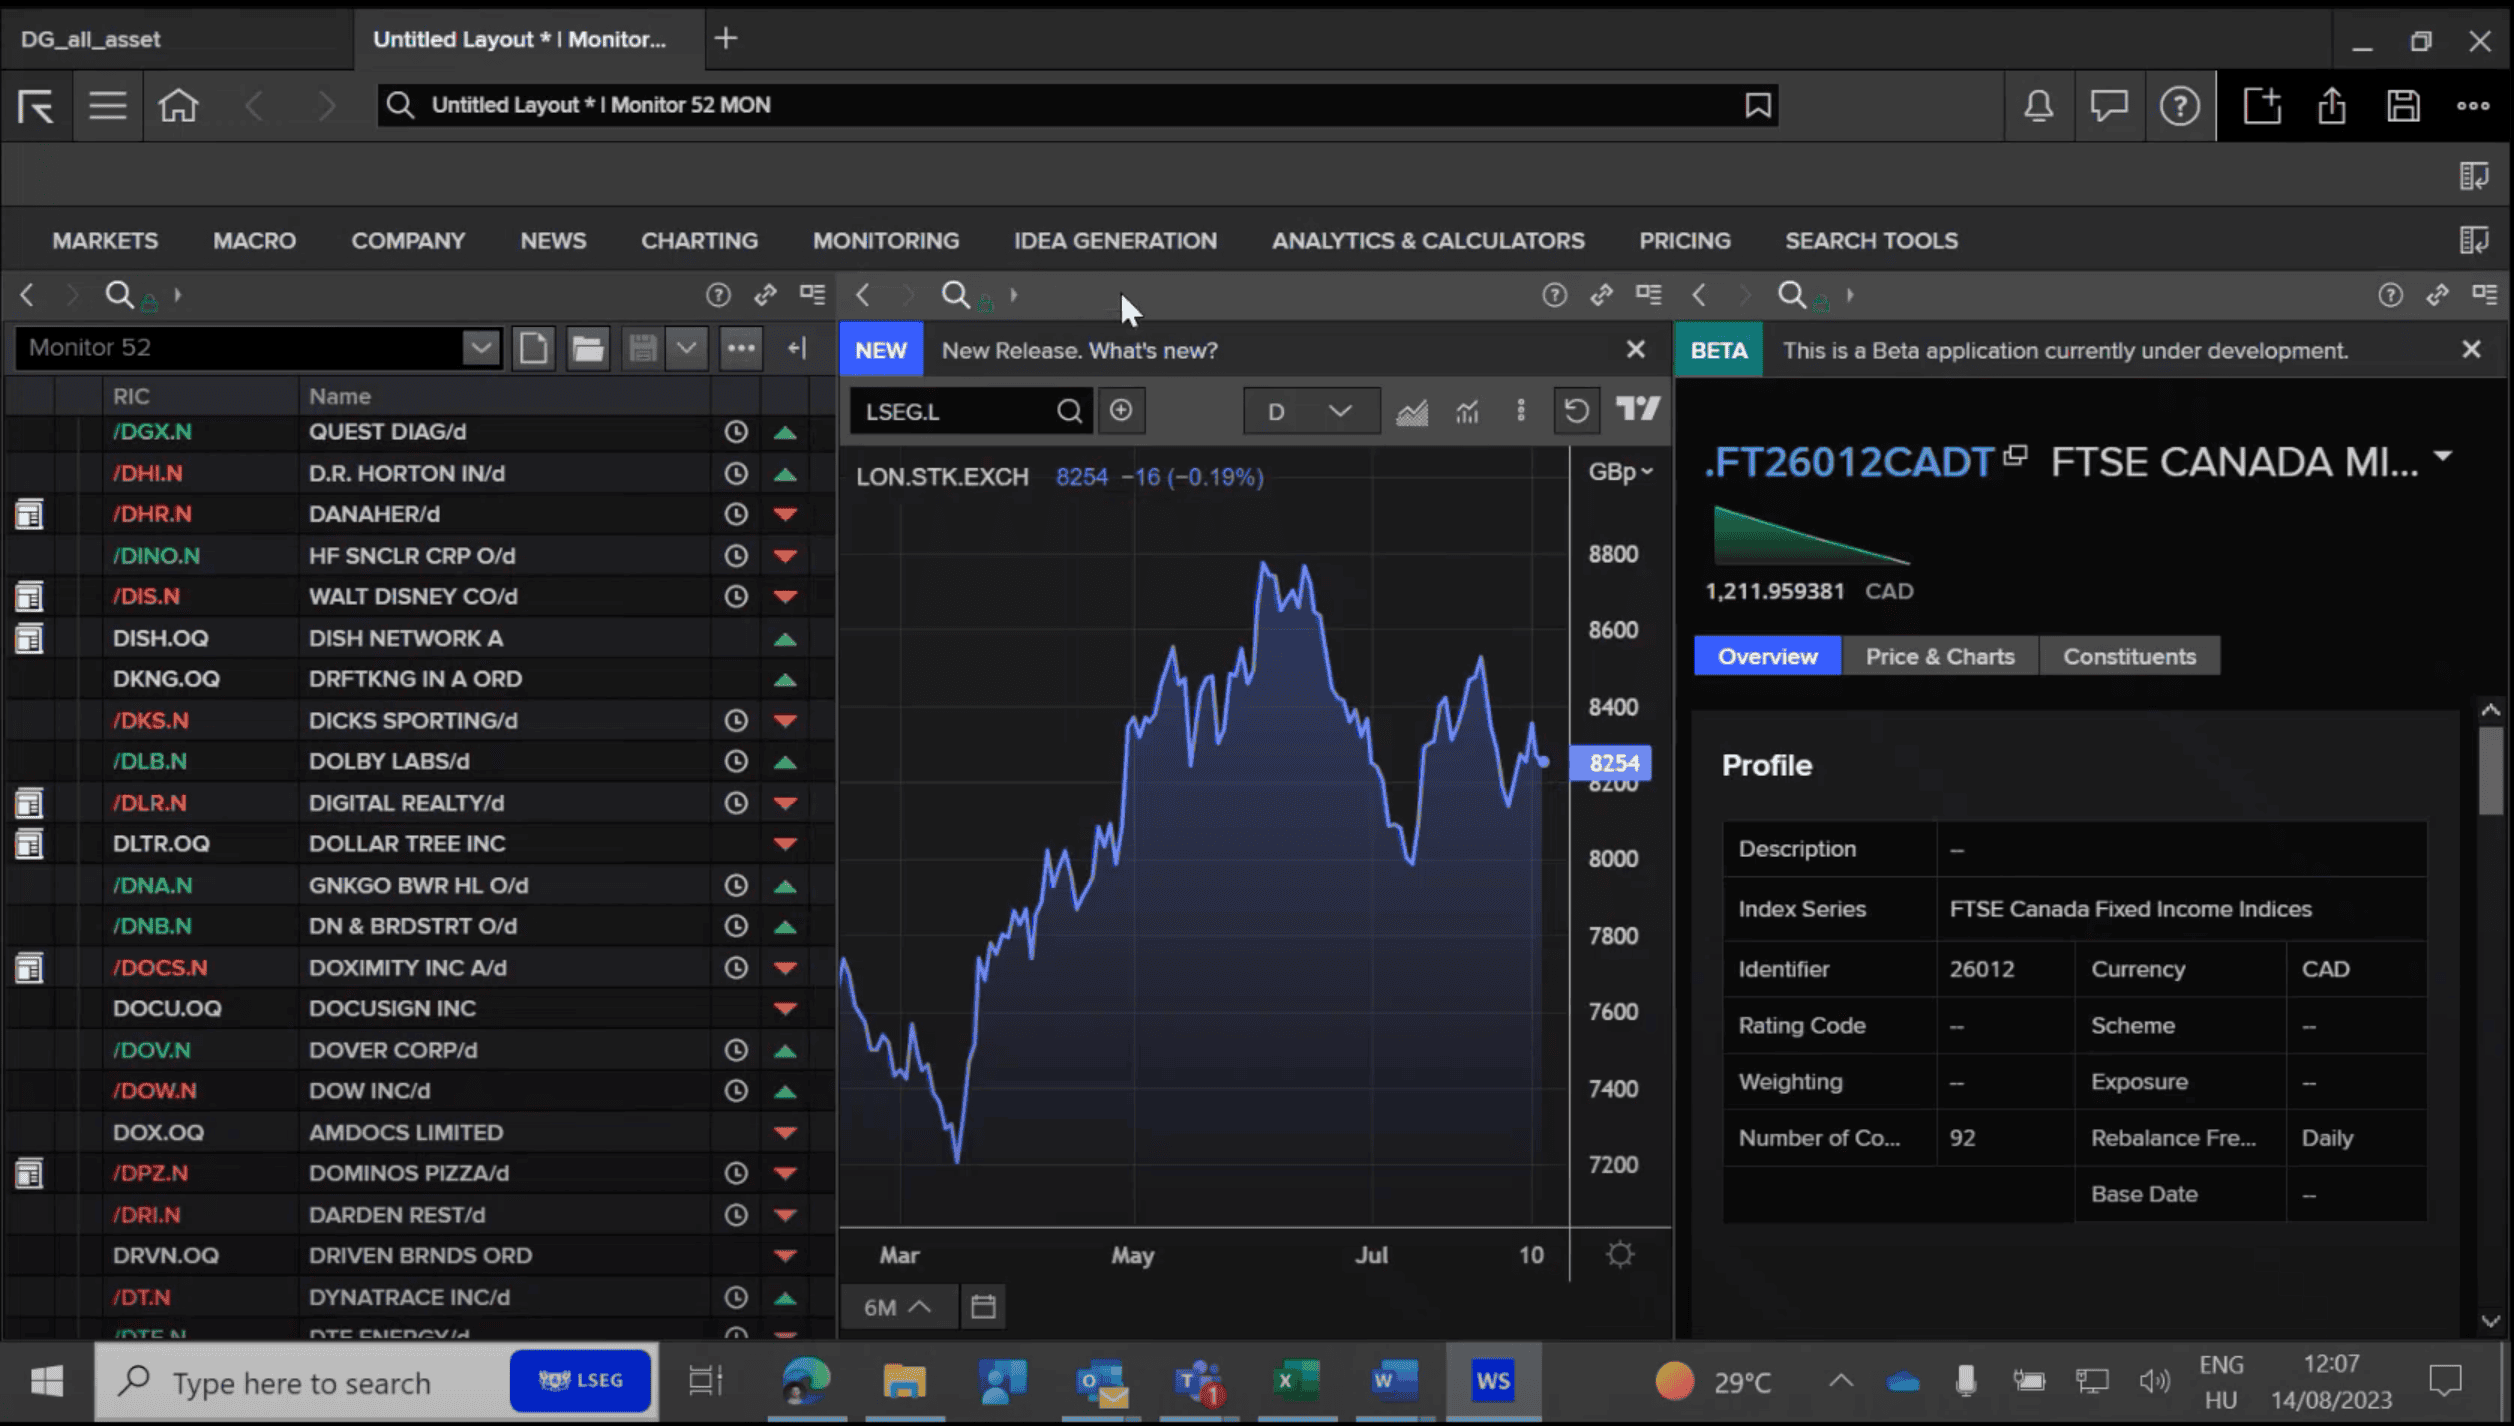
LSEG Workspace (rebranded from Refinitiv after the London Stock Exchange Group acquisition) is a data platform offering news, data, analytics, and trading tools for financial professionals. It includes AI-driven insights, economic indicators, and customizable screening tools.
Portfolio managers can track market-moving news and sentiment, and gain access to extensive historical data to inform future predictions. Its machine learning tools help identify emerging trends in equity markets, and its fixed-income coverage is stronger than most Bloomberg terminal alternatives.
Best For
Deep financial data, analyst reports, and company financials. Particularly strong for fixed income and FX research teams that need global coverage at a lower cost than Bloomberg.
Top Features
- Global market data and news: Real-time access to equity, fixed income, commodities data, and breaking news across global markets.
- Advanced analytics and modeling: Financial modeling, technical analysis, and quantitative research tools for scenario analysis and stress testing.
- Portfolio management and risk analytics: Track performance, manage risk, and assess portfolio exposure across asset classes with integrated real-time data.
Koyfin: Free-Tier Charting and Screening for Independent Research
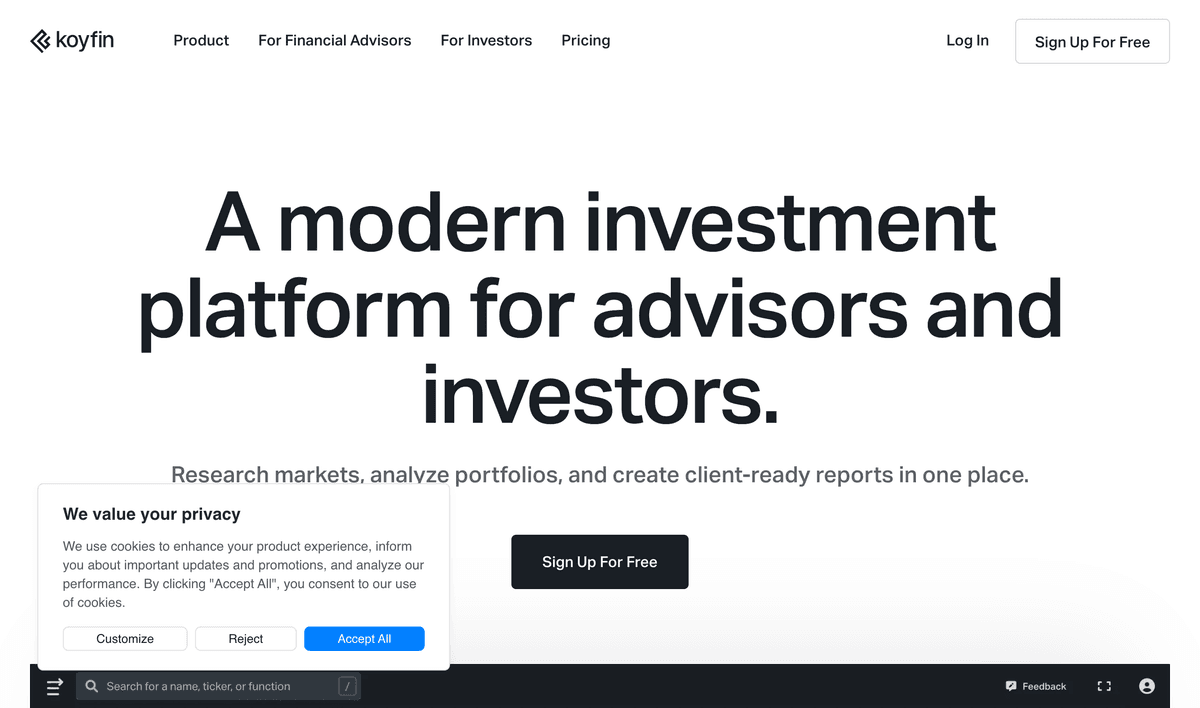
Koyfin is a financial data and analytics platform aimed at independent analysts, RIAs, and smaller buy-side teams. It delivers Bloomberg-quality visualizations at a fraction of Bloomberg's price. It overlaps with dedicated equity research tools on screening and charting but differentiates on price and design. The free tier covers market data, screening, and basic charting. Paid tiers add institutional-grade features like custom dashboards, watchlists, and advanced screening.
What sets Koyfin apart is its visual design. Financial data is presented in clean, interactive charts and tables that make pattern recognition faster than spreadsheet-based analysis. For teams that need to communicate research findings visually (to clients, investment committees, or LPs), Koyfin's output is presentation-ready.
Best For
Independent researchers, RIAs, and small buy-side teams that need investment research tools with broad market data and screening without enterprise terminal pricing. Also popular with financial content creators who need clean charts for publications.
Top Features
- Free tier with institutional data: Market data, news, screening, and basic charting at no cost, with paid tiers starting at $39/month.
- Visual dashboards: Interactive charts, comparison tools, and screening results designed for both analysis and client communication.
- Granular screening: Filter equities by hundreds of fundamental, technical, and valuation metrics across global markets.
Nasdaq Data Link: Alternative and Quantitative Data Feeds
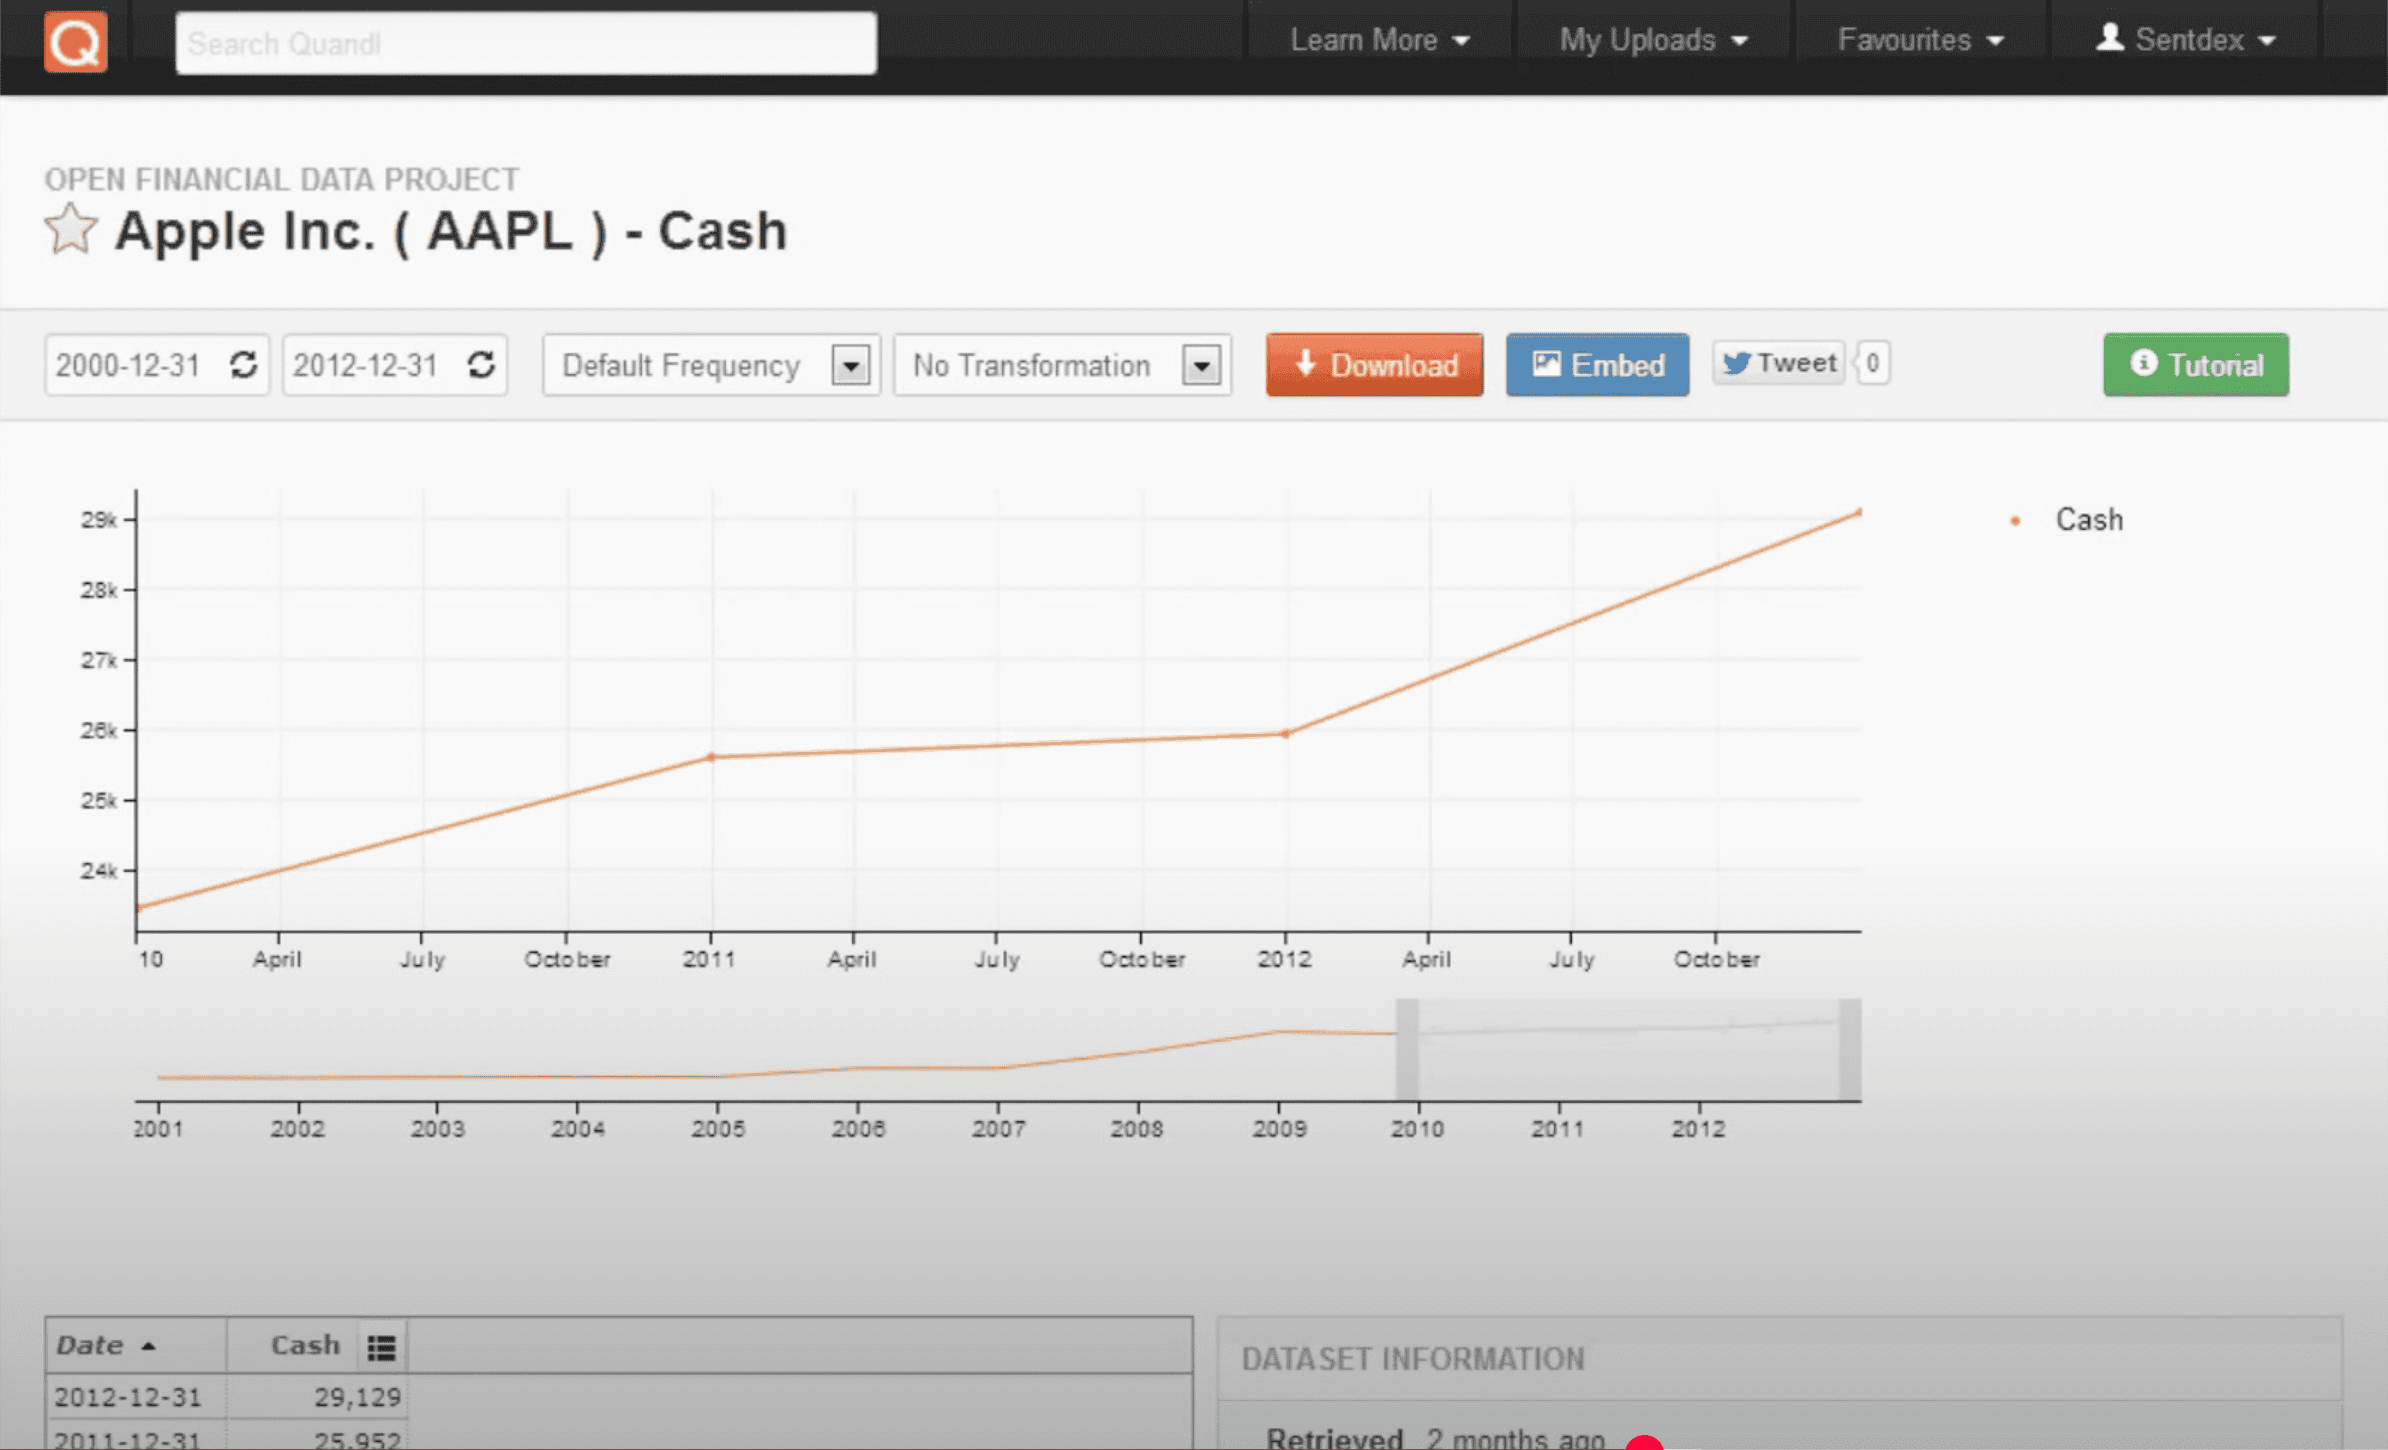
Nasdaq Data Link (rebranded after Nasdaq's acquisition of Quandl) is a data marketplace for accessing alternative and financial datasets. It spans macroeconomic indicators, commodity prices, financial reports, and equity market data, the breadth that makes it a default for quantitative analysts building predictive models.
The platform's strength is its API-first approach. Data integrates directly into Python, R, and Excel workflows without manual downloads or format conversion. For quant teams that need to pull datasets programmatically into models, data arrives in a consistent schema, eliminating the format conversion step that typically precedes any modeling work.
Best For
Quantitative analysts, data scientists, and researchers focused on developing predictive models or using alternative data. Ideal for teams within hedge funds that focus on systematic trading strategies or data-driven research.
Top Features
- Alternative data: Extensive datasets including commodities, macroeconomic indicators, satellite data, and other non-traditional sources.
- Flexible API: Programmatic access that integrates with Python, R, and Excel without format friction.
- Data aggregation: Access to multiple data providers in one marketplace, so you can run comparative analysis and cross-market modeling without juggling logins.
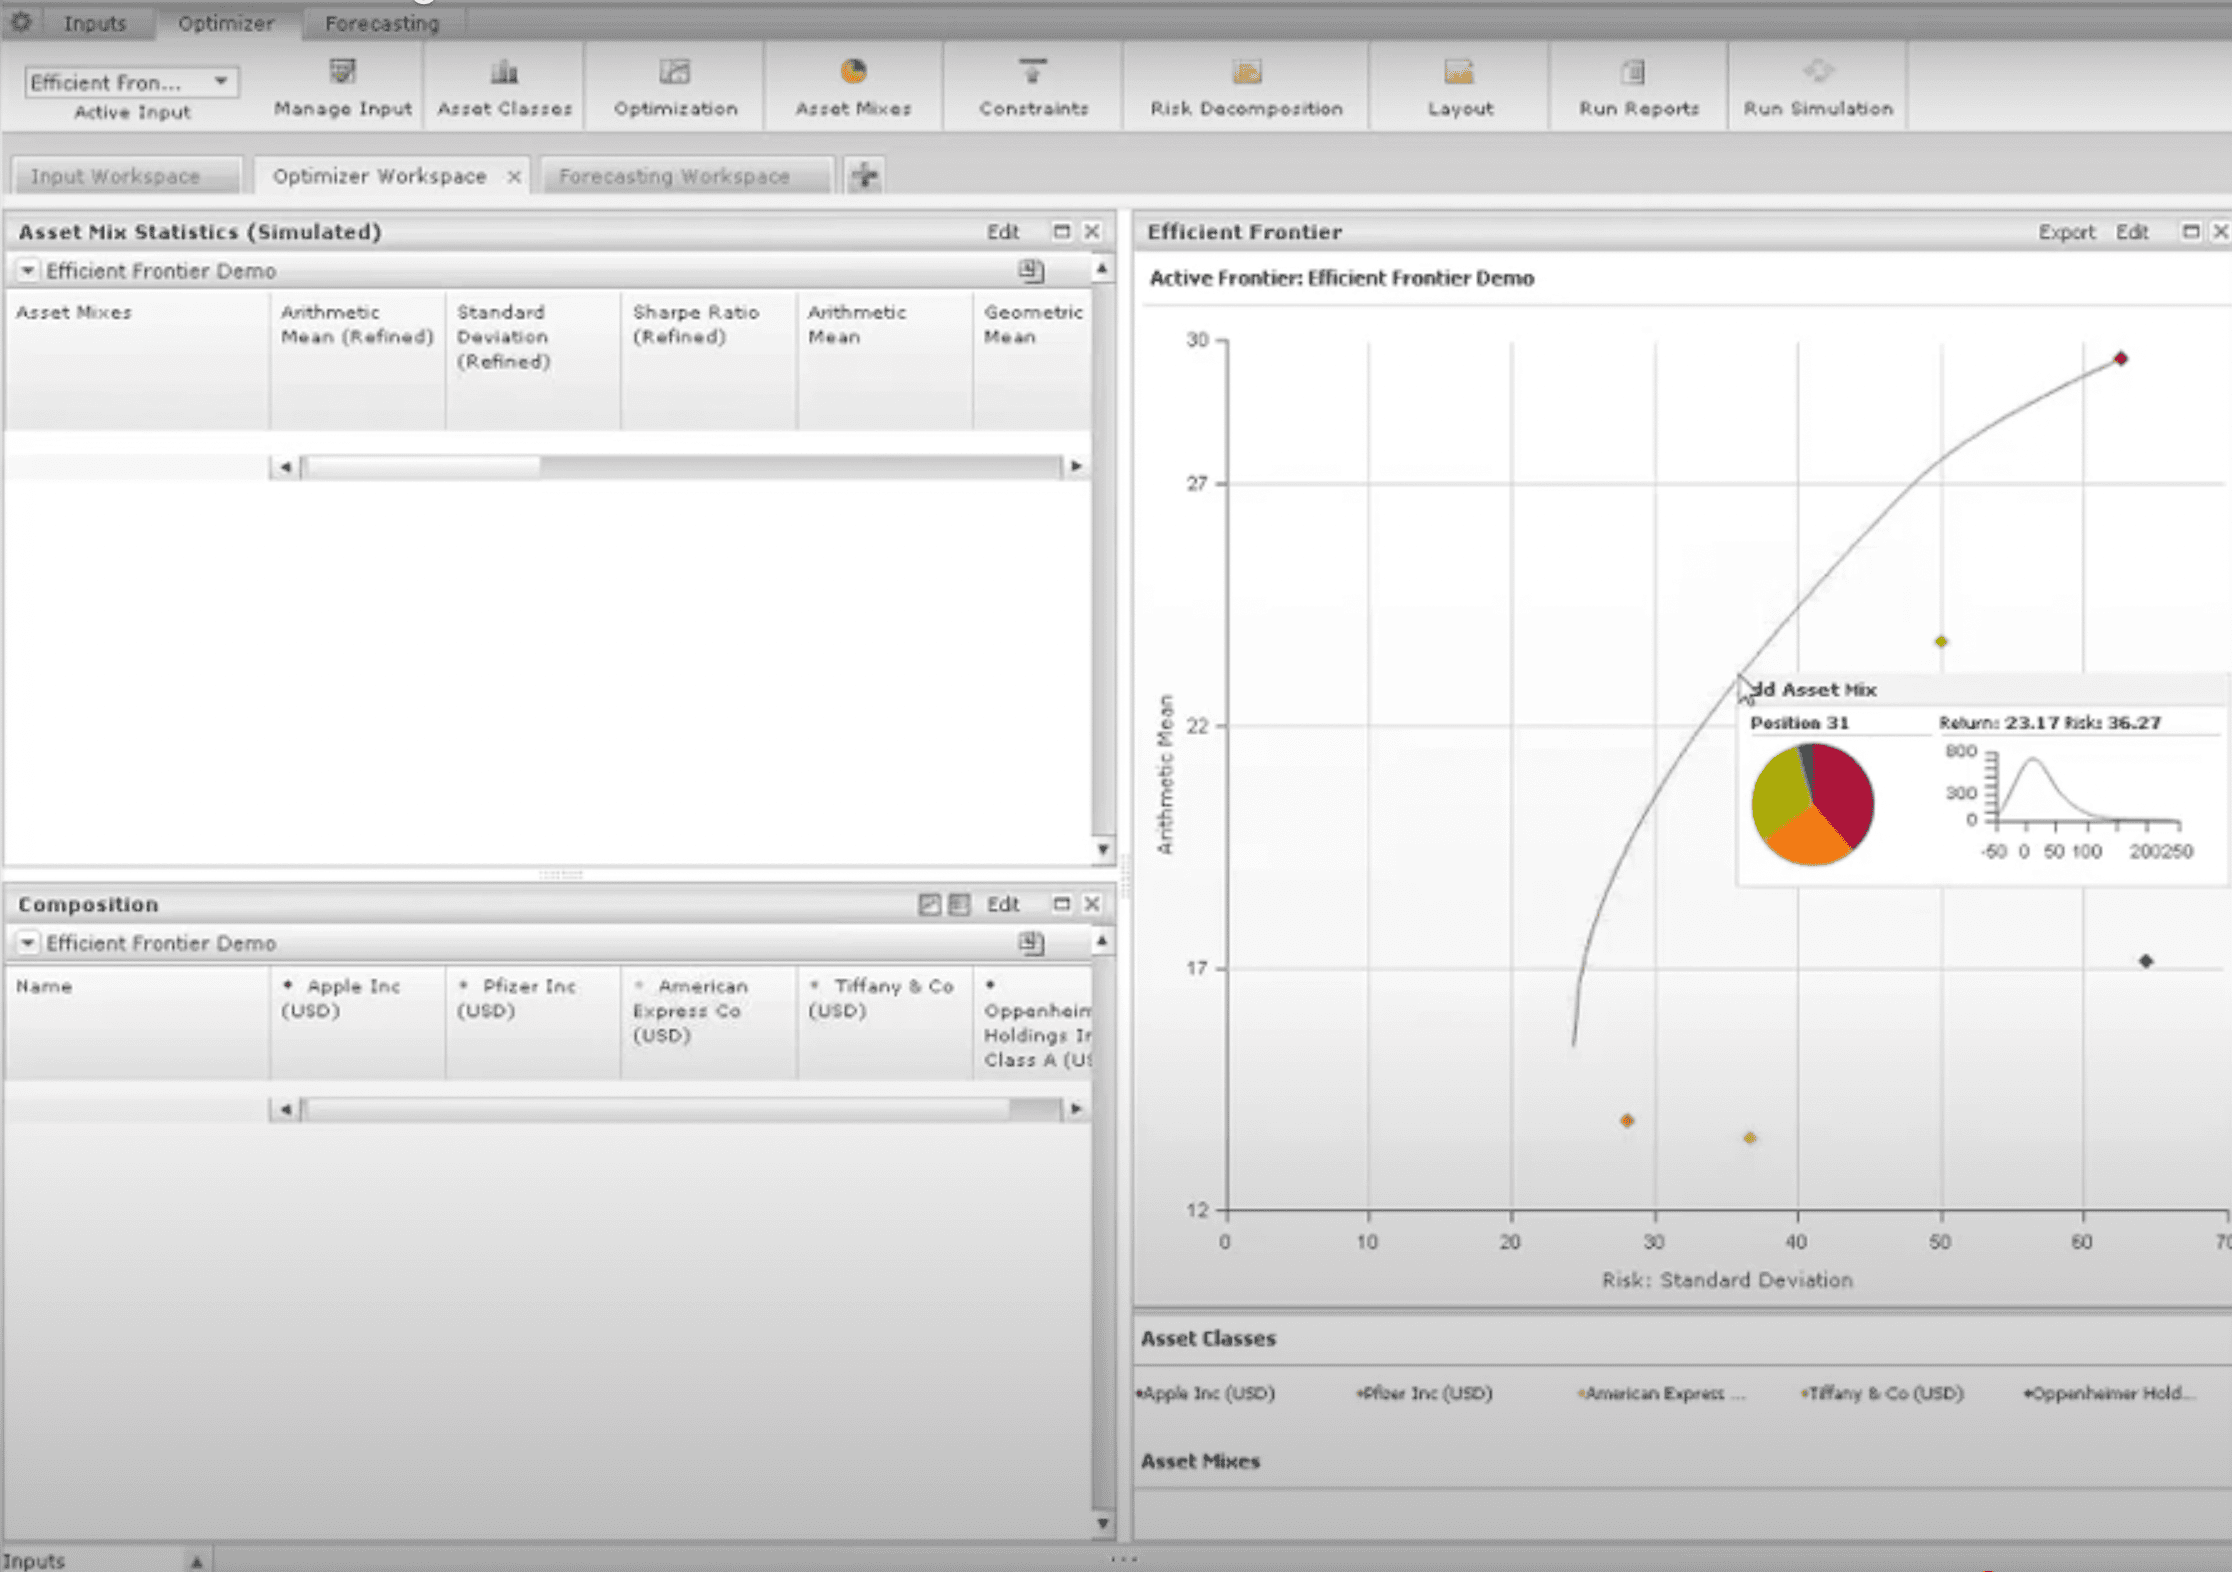
Aladdin by BlackRock: Institutional Risk and Portfolio Management
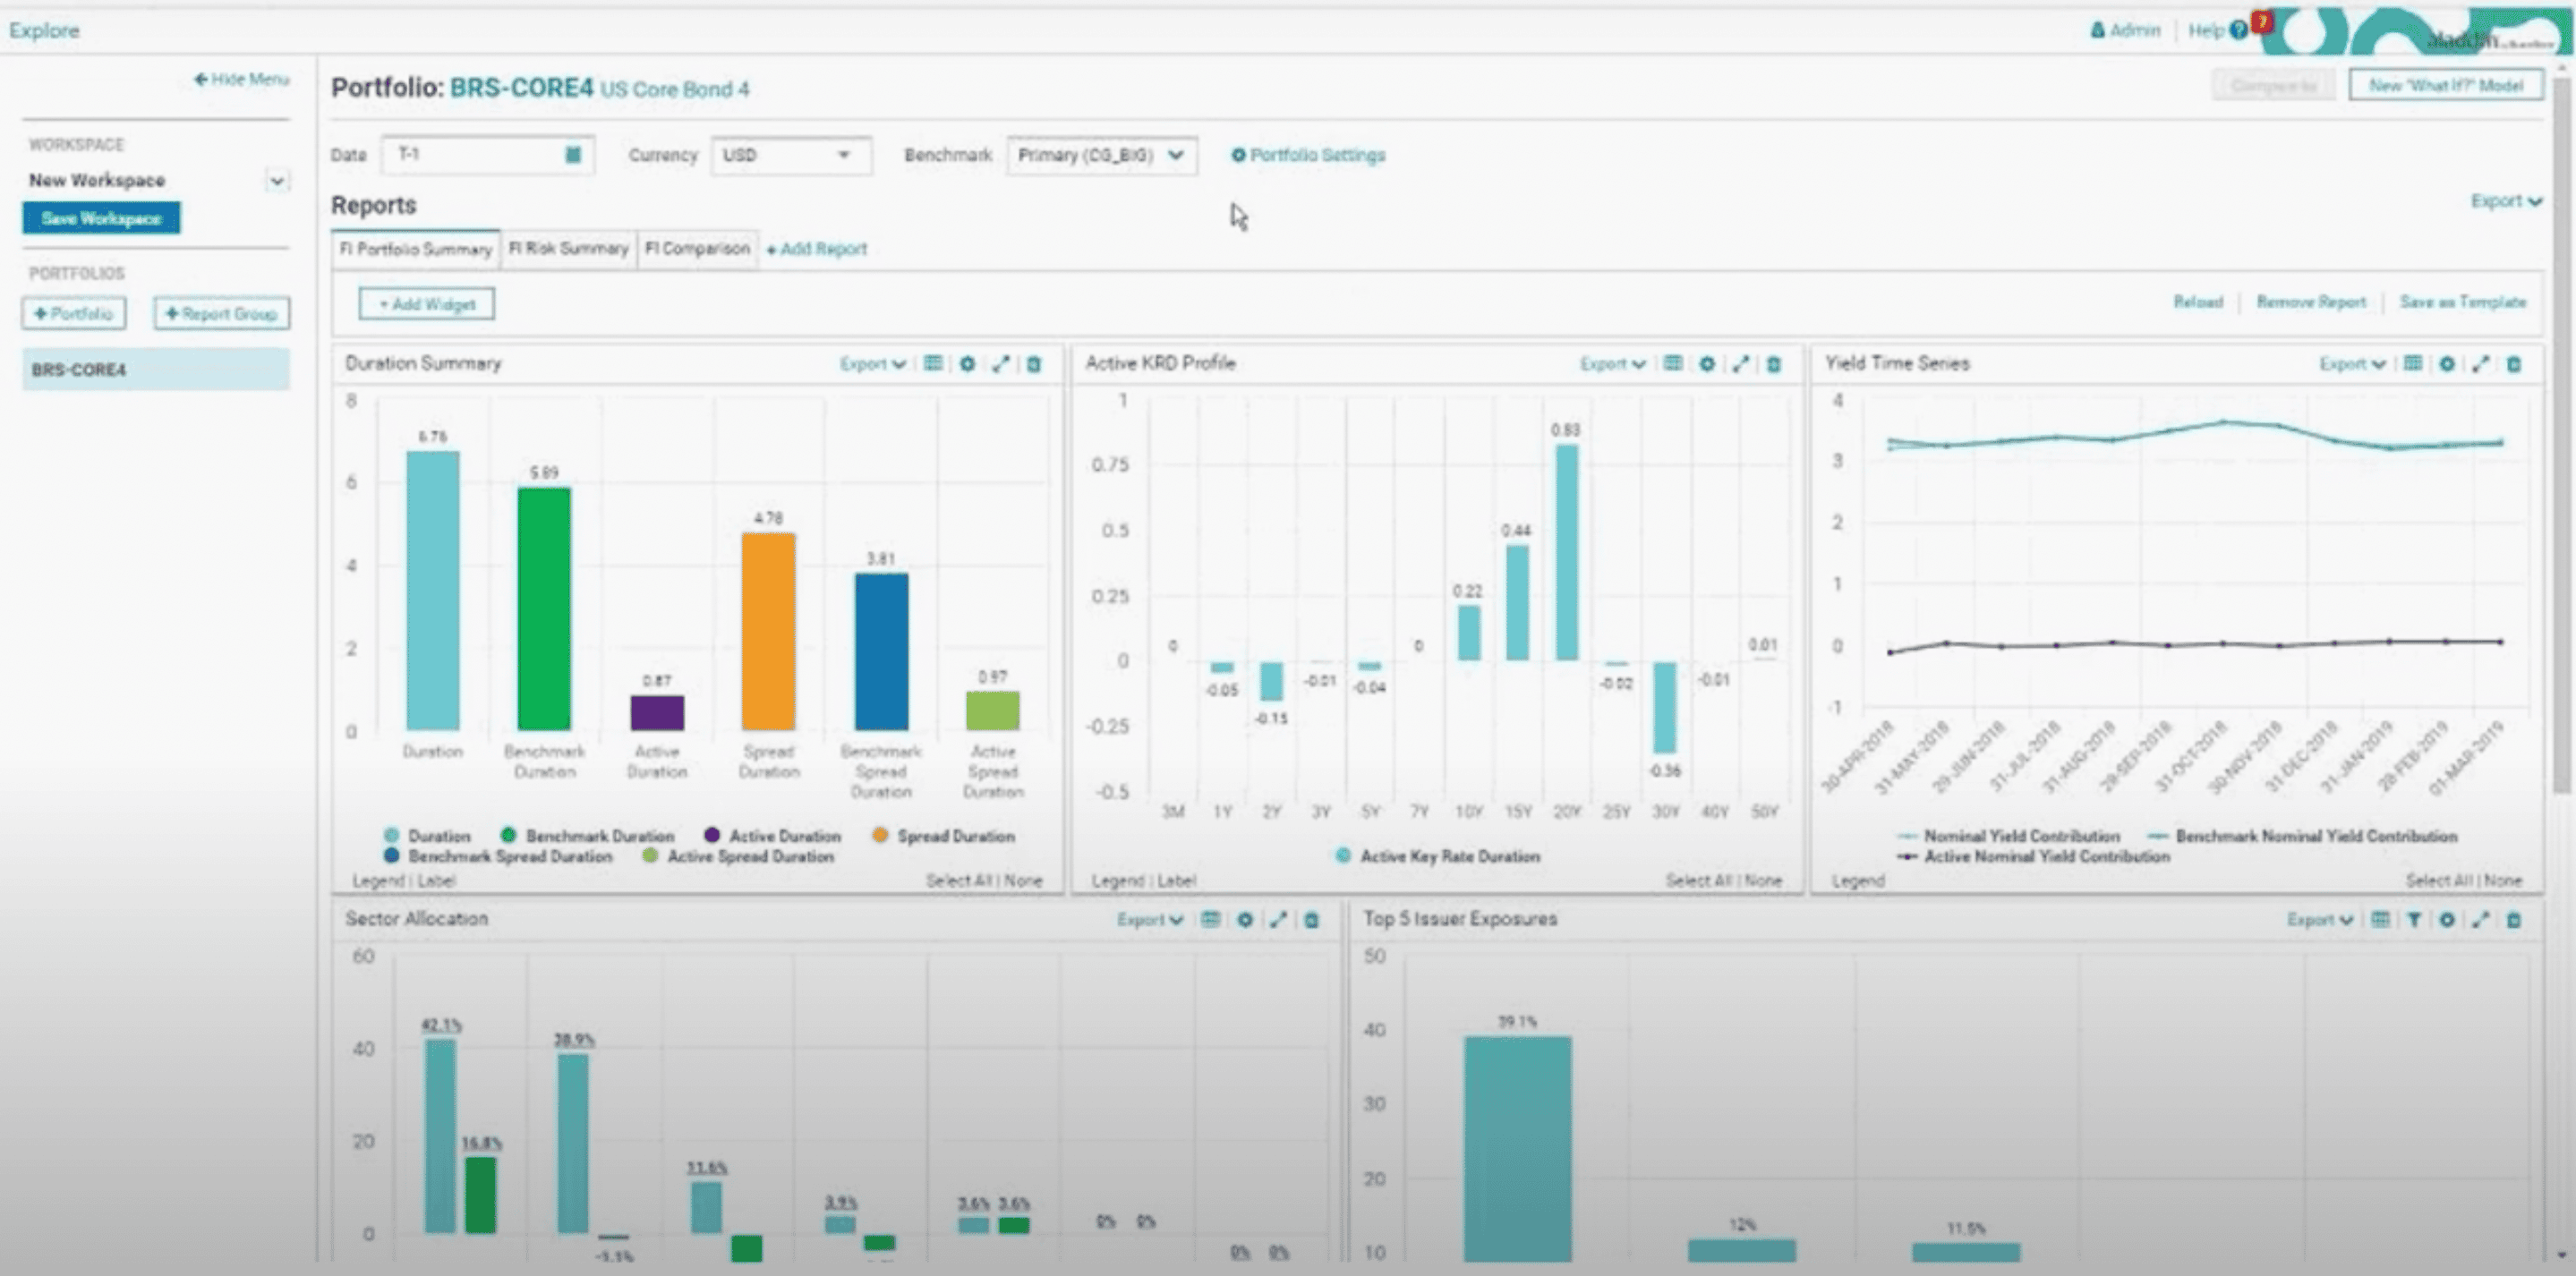
Aladdin is BlackRock's enterprise risk management and portfolio management platform. It integrates financial data, advanced analytics, and risk modeling into a unified system used by institutional investors managing trillions in assets. The platform's risk engine runs Monte Carlo simulations and scenario analysis across entire portfolios.
Aladdin is not a research tool in the traditional sense. It is a portfolio infrastructure platform. But for large institutional investors, the risk analytics and portfolio construction tools inform research priorities: when Aladdin flags concentration risk in a sector, the research team investigates.
Best For
Portfolio managers, risk analysts, and investment managers at large institutional investors. Primarily used by teams focused on risk-adjusted returns, asset allocation, and portfolio optimization at scale.
Top Features
- Risk management: Stress testing, scenario analysis, and VaR modeling across multi-asset portfolios.
- Portfolio optimization: Algorithms for balancing risk and return through optimal asset allocation.
- Integrated real-time data: Access to real-time market data, analytics, and trading platforms for institutional-scale decision-making.
S&P Capital IQ: Company Screening, Credit Analysis, and M&A Data
S&P Capital IQ is a research platform from S&P Global that combines company financials, M&A data, credit analysis, and screening tools. Xpressfeed, now integrated into the Capital IQ platform, delivers customized financial data feeds for quantitative teams that need bulk data in their own systems.
The platform is particularly strong for credit analysis, private company data, and M&A research. Analysts tracking leveraged buyouts, distressed debt, or private market transactions often rely on Capital IQ's deal database and credit ratings data.
Best For
Credit analysts, M&A researchers, and investment bankers who need company financials, deal data, and credit analysis. Also serves quantitative teams (via Xpressfeed) that need high-volume data delivery for systematic strategies.
Top Features
- Company and deal data: Comprehensive financials, M&A transaction data, and private company information not available on most terminals.
- Credit analysis: S&P credit ratings integration, default probabilities, and credit risk tools.
- Customizable data feeds (Xpressfeed): Tailor data delivery to specific research needs, including real-time and historical data at scale.
How to Choose the Right Investment Research Tool
Most professional research teams use two to four investment research tools in combination. Here is a practical framework for deciding which belong in your stack:
Start with your research style. Fundamental analysts who build models and read filings need a data terminal (Bloomberg, FactSet, or LSEG Workspace) plus a document search tool (AlphaSense). For quant teams running systematic models, the priorities flip: API-first data (Nasdaq Data Link, Xpressfeed) and a risk platform (Aladdin or FactSet's risk module) matter more than document search.
Add a monitoring layer. About one-third of monitored financial pages changed in any given 30-day window, which means manual checking misses roughly one update in three. Tools like Visualping fill this gap by alerting you when IR pages, regulatory filings, or competitive pricing changes happen, before the change shows up in a terminal newsfeed or research note.
Factor in team size and budget. A solo analyst can get surprisingly far with Koyfin (free), Visualping (free tier), and SEC EDGAR access. A mid-size fund might combine FactSet + AlphaSense + Visualping. Large institutions typically run Bloomberg + Aladdin + multiple specialized data feeds.
Those same monitors logged 625,000+ page checks in a single month, and about 1 in 11 flagged a meaningful change. Frequent enough to miss manually; infrequent enough to waste hours watching. Automated monitoring solves both problems.
Go deeper: Stock Research Tools | Stock Market Research | Event-Driven Investing Strategies
Frequently Asked Questions
What is the best investment research tool for fundamental analysis?
Bloomberg Terminal and FactSet are the two leading platforms for fundamental equity research. Bloomberg offers broader market data coverage and a professional messaging network. FactSet provides deeper customization for financial modeling and screening workflows. For teams on a tighter budget, Koyfin covers much of the same data visualization at a fraction of the cost. AlphaSense adds AI-powered document search that can cut hours off the filing review process.
How much do investment research tools cost?
Costs range from free to $24,000+ per year. Koyfin and Visualping both offer functional free tiers. AlphaSense starts around $10,000/year. FactSet typically runs $12,000-$20,000/year depending on data packages. Bloomberg Terminal is approximately $24,000/year per seat. Enterprise platforms like Aladdin and S&P Capital IQ are priced on a custom basis and typically require multi-year commitments.
Can I monitor SEC filings and IR pages automatically?
Yes. Page monitoring agents like Visualping can track any public web page, including SEC EDGAR filings, investor relations pages, and regulatory announcements. When a page changes, you get an alert with a highlighted comparison and an AI summary of what changed. In a sample of 46,000 financial monitors, investor relations pages account for over a third of all monitored URLs.
What is the difference between a financial terminal and a research platform?
A financial terminal (Bloomberg, LSEG Workspace) provides real-time market data, news, trading execution, and communication tools in a single interface. A research platform (FactSet, Morningstar Direct, AlphaSense) focuses on analysis workflows: financial modeling, screening, document search, and performance attribution. Most investment teams use at least one of each. Monitoring tools like Visualping add a third layer: real-time surveillance on specific web pages that terminals and research platforms do not track.
What investment research tools do hedge funds use?
Most hedge funds use a combination based on their strategy. Fundamental/long-short funds typically run Bloomberg + FactSet or AlphaSense. Quantitative funds rely on Nasdaq Data Link, Xpressfeed, and custom data pipelines. Multi-strategy funds often have all of the above plus Aladdin for risk management. For event-driven strategies, website monitoring (Visualping) has become a standard layer: the team that catches an IR page update or pricing change first holds a time-sensitive edge.
How do I track competitor pricing and product changes for investment research?
Set up automated monitoring on the specific web pages that matter to your thesis. Our guide on how to monitor any website covers the setup in detail. Paste the URL of a company's pricing page, product page, or IR section into Visualping, set a check frequency (as often as every 2 minutes on Business plans), and the tool handles the rest. You get alerts only when something meaningful changes, filtered by your custom criteria. This is particularly useful for tracking companies in a coverage universe where pricing signals, product launches, or financial compliance filings move the stock.
This article is for informational purposes only and does not constitute investment advice. Consult a qualified financial professional before making investment decisions.
Want to uncover leading market signals?
Monitor any web source online, and get notified of market-moving events, with Visualping.
Emily Fenton
Emily is the Product Marketing Manager at Visualping. She has a degree in English Literature and a Masters in Management. When she’s not researching and writing about all things Visualping, she loves exploring new restaurants, playing guitar and petting her cats.