What 100,000+ Users Monitor with the Visualping API
By Eric Do Couto
Updated March 30, 2026

Your competitor changed their pricing page at 2 AM on a Tuesday. Your compliance team has 500 government pages to watch for regulatory updates. Your engineering lead needs to know the second a vendor pushes a breaking API change.
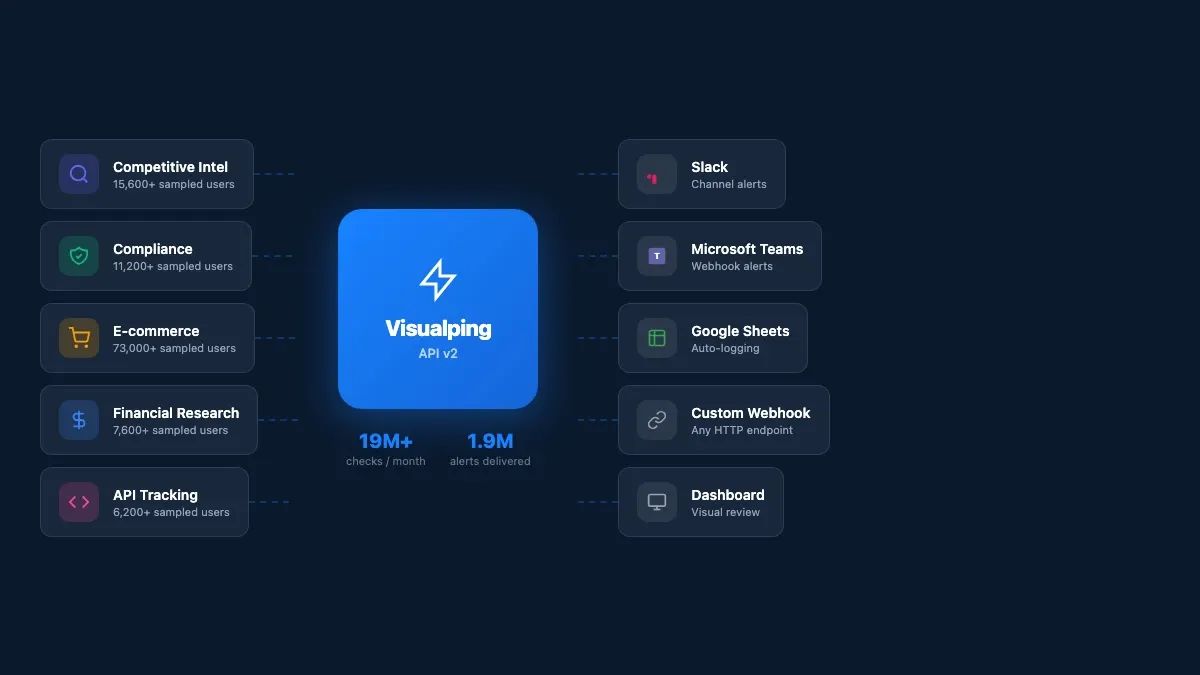
These are not edge cases. Among a sample of active Visualping accounts, price tracking is the most common use case (over 73,000 users), followed by competitor monitoring (15,600+), regulatory and compliance tracking (11,200+), and software release monitoring (6,200+). In a 30-day window, the platform processed over 19 million monitoring checks and delivered 1.9 million change notifications across software companies, financial services firms, law practices, government agencies, and universities.
This post covers what those teams actually monitor, how they set it up, and two API patterns (cross-monitor reporting and natural language querying) that turn raw change data into intelligence.
If you are looking for the technical setup guide (API calls, webhooks, batch scripting), start with our API tutorial.
Competitive intelligence
Among sampled users, over 15,600 report competitor monitoring as their primary use case. Crayon's State of Competitive Intelligence report found that 98% of businesses consider CI important to their success, yet most still rely on manual processes.
The typical API-driven setup: 50-200+ URLs across a competitive landscape, covering pricing pages, feature lists, and marketing messaging. AI-powered competitor monitoring summaries flag pricing restructures and positioning shifts. Alerts route to a dedicated Slack channel. In our CRM, software companies, IT services firms, and marketing agencies are the most active buyers of competitive monitoring at scale, with sampled marketing agency accounts averaging the highest monitor counts per user of any industry.
Compliance and regulatory
Over 11,200 sampled users report tracking laws and regulations as their primary use case. Law practices and legal services firms rank among the top industries for power users with 100+ active monitors. According to Thomson Reuters' 2024 regulatory intelligence report, the average organization tracks regulatory changes across 750+ sources.
These teams use compliance monitoring to watch terms of service, privacy policies, regulatory filings, and government pages across vendors, partners, and agencies. The importance filter flags changes to liability language and data handling clauses. Cosmetic updates (typo fixes, copyright year changes) stay silent.
E-commerce pricing
Price tracking is the single most popular self-reported use case: over 73,000 sampled users watch for price changes and out-of-stock transitions. Retail and e-commerce monitoring teams track competitor pricing data, inventory status, and promotional offers.
Importance definitions target specific triggers (price drops below a threshold, stock status changes, new product listings). Webhooks feed detected changes directly into pricing optimization systems or internal dashboards.
Financial research
Financial services monitoring is the sixth-largest industry among sampled users (7,600+), and sampled power users in the industry average over 890 active monitors each. Investment firms and research analysts monitor SEC filings pages, investor relations portals, earnings calendars, and executive team pages.
One API script sets up monitors across hundreds of public company websites. Importance definitions target leadership changes, financial restatements, and M&A language. Some users also monitor PDF documents directly: over 22,600 sampled jobs track PDF files like quarterly reports and regulatory filings.
API dependency tracking
Over 6,200 sampled users report software release notes as their primary monitoring use case. Another 1,400+ jobs monitor website changes via API calls to JSON endpoints directly. Engineering teams set up API changelog monitoring for the documentation, changelog, and status pages of every third-party service their product depends on. When a vendor pushes a deprecation notice, the team finds out from a Slack alert, not a production incident at 2 AM.
 Five use cases, one API with alerts routing to any tool your team uses
Cross-monitor reporting
Individual job endpoints are useful for drilling into a single monitor. But when you want the full picture (what changed across all 200 monitors this week?), the report endpoint returns a reverse-chronological activity feed across every job in your workspace:
report = requests.post(
    "https://job.api.visualping.io/v2/jobs/report-page",
    headers=headers,
    json={
        "workspaceId": WORKSPACE_ID,
        "scope": {"comboId": -WORKSPACE_ID},
        "includeErrors": True,
        "level": "allChecks"
    }
)

for item in report.json().get("items", []):
    ai = item.get("aiOutput", {})
    summary = ai.get("changeSummary", "")
    if summary:
        flag = "IMPORTANT" if ai.get("changeIsImportant") else "change"
        print(f"[{flag}] {item.get('description')}")
        print(f"  {summary}")
Each item includes an aiOutput.changeSummary (plain-English description of what changed) and a changeIsImportant flag tied to your importance definition. Here is real output from our own competitive SERP monitors:
[change] Guru99 - Best Website Change Detection
  Added a 2026 top tools overview with PageCrawl.io and AI-powered
  tracking, and removed several older tool endorsements.

[change] Guru99 - Web page change detection software
  Expanded coverage of features and popular tools for website change
  detection, including monitoring types, alert options, dynamic content
  support, and AI-assisted summaries.
Those summaries are generated automatically by the API. No parsing HTML diffs, no regex, no manual review. The AI reads the before and after and tells you what happened in a sentence.
Visualping also compiles these summaries into scheduled visual reports you can share with your team:
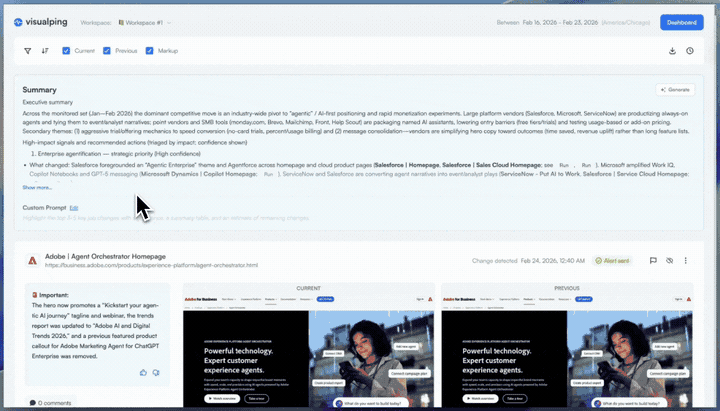 A scheduled report compiles AI summaries, screenshots, and diffs into one briefing
Query your monitoring data in natural language
The report endpoint returns structured data with AI summaries. Feed that into an AI assistant and ask questions about your monitoring results in plain English.
import requests
import json

API_KEY = "YOUR_API_KEY"
WORKSPACE_ID = YOUR_WORKSPACE_ID
headers = {
    "Authorization": f"Bearer {API_KEY}",
    "Content-Type": "application/json"
}

# Step 1: Pull recent changes from Visualping
report = requests.post(
    "https://job.api.visualping.io/v2/jobs/report-page",
    headers=headers,
    json={
        "workspaceId": WORKSPACE_ID,
        "scope": {"comboId": -WORKSPACE_ID},
        "includeErrors": False,
        "level": "allChecks"
    }
)

# Step 2: Format changes for the AI
changes = []
for item in report.json().get("items", []):
    ai = item.get("aiOutput", {})
    if ai.get("changeSummary"):
        changes.append({
            "monitor": item.get("description"),
            "url": item.get("url"),
            "date": item.get("screenshotLogCreated"),
            "summary": ai["changeSummary"],
            "important": ai.get("changeIsImportant", False)
        })

# Step 3: Ask a question
question = "Which competitors changed their positioning this week?"
context = json.dumps(changes, indent=2)

# Feed `context` + `question` into your AI assistant of choice
# The AI reads the structured change data and answers conversationally
We tested this against our own monitors. With four SERP-tracking monitors that detected changes on March 26, we asked: "Which competitor SERPs changed this week, and did anyone new show up?"
The answer (generated from the API's AI summaries): PageCrawl.io appeared as a new competitor in the "best website change detection" SERP, displacing several older tool endorsements. Across all four tracked SERPs, Google expanded its featured content about monitoring types and AI-assisted summaries.
That answer came from raw API data. No human read the diffs. The pipeline was: Visualping detects the change, the API generates a summary, and an AI assistant answers your question using those summaries as context. Two API calls and a prompt.
 The same AI summaries that power the API appear in Visualping's visual reports
Worth noting (and this surprised us too): the people buying website monitoring at scale are not always engineers. In a sample of opportunity-stage contacts in our CRM, the most common job functions are executives and directors, followed by research analysts and marketing leads. This kind of natural language query layer is what makes the API accessible to them.
Get started
If you are ready to set up the API, the technical tutorial covers authentication, creating monitors, webhooks, batch scripting, and error handling.
To start monitoring without code, sign up at visualping.io and use the dashboard. Monitors you create through the dashboard work with the API too (and vice versa).
Want to monitor web changes that impact your business?
Sign up with Visualping to get alerted of important updates from anywhere online.
Eric Do Couto
Eric Do Couto leads Marketing at Visualping, where he builds the systems that connect website change data to marketing. He writes about competitive monitoring, AI-driven optimization, and the tools that make both work at scale.