Free Competitive Intelligence Tools: 10 at $0, 5 Paid (2026)
Updated July 21, 2026

Publisher disclosure: Visualping created this guide and appears in the website-change category. Tool inclusion follows the method described below, and quote-only prices are labeled estimates. The full disclosure covers which jobs other tools win.
TL;DR: Free competitive intelligence tools cover different data sources. Pick by job, free tiers first:
Job Best tool What the free tier gets you Paid starts at Competitor ad creative on Meta and Google Meta Ad Library, Google Ads Transparency Meta: live ads. Google: ads served over a chosen period. Fully free, no account Free Any competitor page change: pricing, homepage positioning, IR/PR, ad-library launches, product pages, visual regression Visualping 5 pages, 150 checks/mo, AI change summaries, API access $10/mo (annual) Competitor keyword, backlink, and PPC data Semrush, Ahrefs, SpyFu Semrush free: 10 reports/day. SpyFu free: truncated results. Ahrefs: own site only $29/mo (Ahrefs Starter or SpyFu annual) Funding rounds, leadership moves, company news Google Alerts, Owler, Crunchbase Alerts: up to 1,000 per account. Owler: follow 5 companies. Crunchbase: basic profiles $39/mo (Owler Pro, annual) Battlecards, win/loss, sales enablement Klue or Crayon No free tier in this category ~$15,000/yr (est.) SEC filings, broker research, premium content AlphaSense No free tier (sales-arranged trials) ~$10,000-$30,000/yr per seat (est.) Continuous market and competitor monitoring, mid-market Contify No free tier (sales-arranged trials) ~$6,000-$15,000/yr (est.) Free-tier limits and public list prices were re-verified on vendor pricing pages on July 21, 2026. Quote-only ranges are labeled estimates from public benchmarks.
One data point to anchor the scale. In a Visualping sample, HubSpot's pricing page changed on 96% of monitors in 30 days. Zoom: 100%. Datadog: 89%. A quarterly pricing review learns about most of these changes weeks late. Jump to the tool-by-use-case handoff or the decision matrix by team size.
Already know what you need to monitor? Track your first 5 competitor pages in 90 seconds. Start free with Visualping. No credit card.
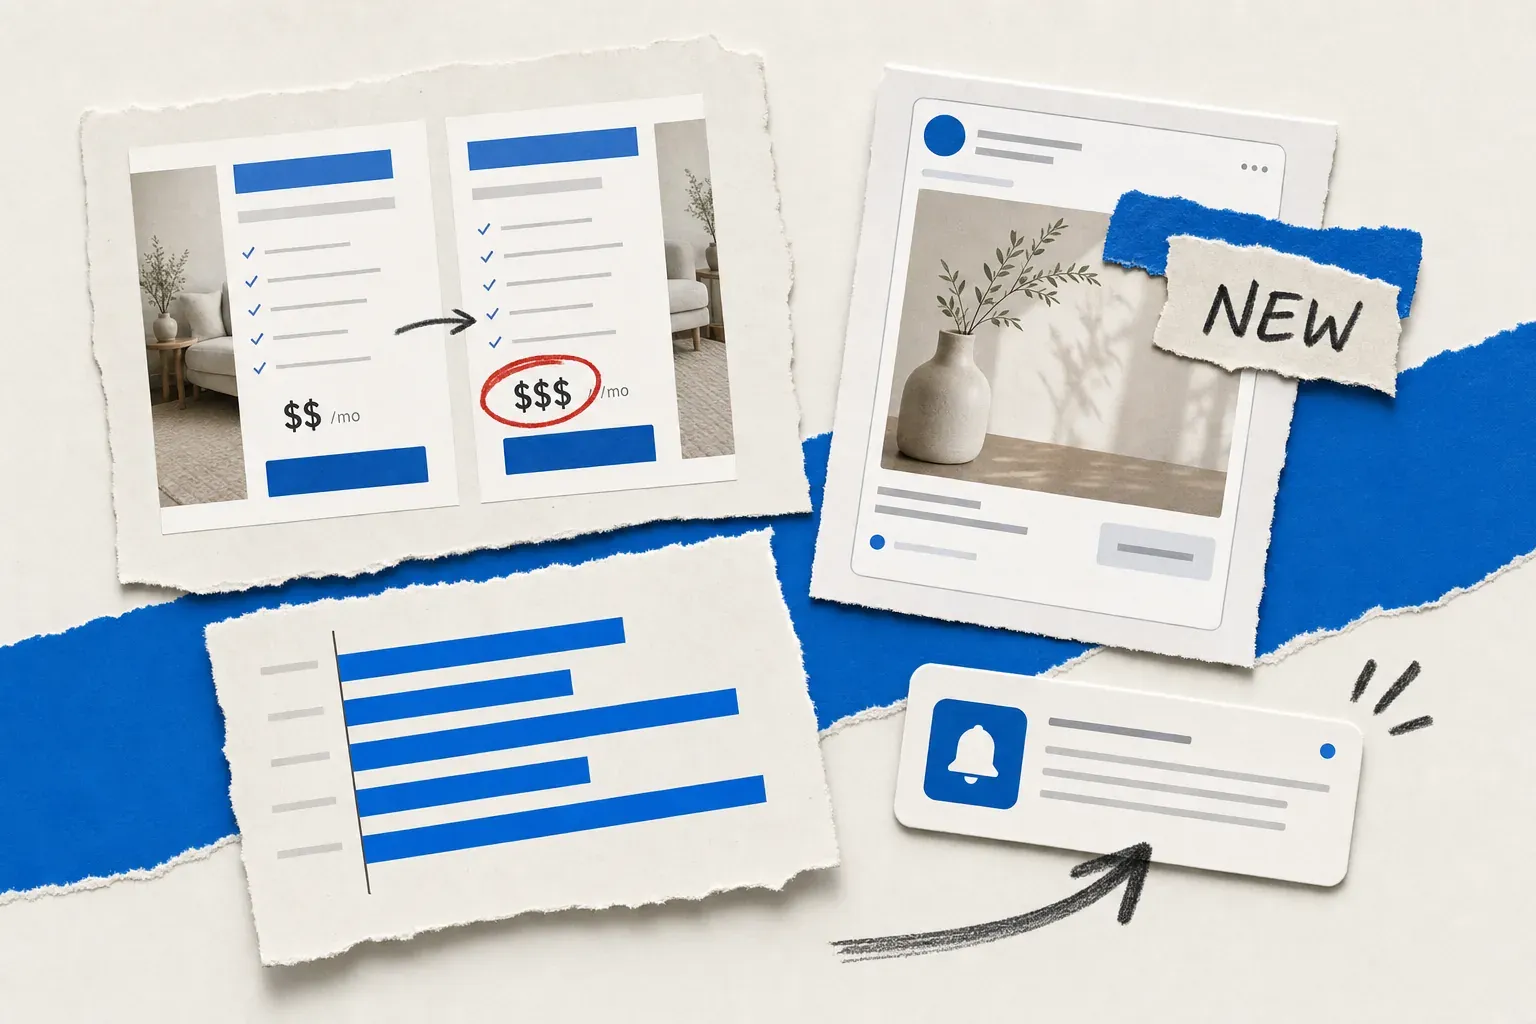 Competitive intelligence tools cluster into pricing, change detection, ads, SEO, and research
Competitive intelligence tools do the work analysts used to do by hand. They watch pricing pages. They track new product launches. They map keyword gaps. They flag funding rounds. An SCIP benchmark of 1,000+ CI pros found 61% of businesses say competitive intelligence drives revenue. For teams that share insights weekly, that number rises to 72%. The real question is which tool does which job.
This guide compares 15 tool entries, counting Google Alerts and Google Trends as one, with the free tiers up front. Ten of the 15 are free or have a usable free tier. Five have none, and each entry says which. We group them by what they actually track. Visualping is one of the 15. It covers website and change monitoring. Klue is the stronger pick for battlecards and win/loss. AlphaSense for enterprise financial research, Contify for continuous mid-market market monitoring. Semrush or SpyFu for SEO data. The disclosure section below routes you to the right tool for each job. Pair any of these with a battlecard template that stays current so the intel actually reaches live deals.
Where CI teams look reveals what signal they trust. We pulled a Visualping sample of 245,000 active monitors set on competitor-relevant page types: pricing, careers, news and blog, changelog, and product. The change rates split sharply by content type. Changelog and release-note pages flagged a detected change on 73% of monitors in 90 days. Careers pages: 65%. Pricing pages: 59%. Product and feature pages: 58%. Pricing pages run on the fastest schedules (median 4.6 hours, with 96% of monitors checked at least daily). Competitive intelligence spans pricing, regulatory, news, financial, hiring, and product monitoring. Each one moves at its own speed. No single tool wins every category. Tools surface the changes; judging what they mean takes a model of competitive advantage types and their public signals.
Five tool categories follow, free-first. Website and change monitoring. SEO and keyword intelligence. Ad and social monitoring. Company and market research. Paid all-in-one CI platforms. The full comparison table sits after the tool sections. Skip to how to choose a CI stack if you already know your category.
Free competitive intelligence tools by the data they uncover
A working competitive intelligence program can start at zero dollars, with one honest caveat: this $0 starting stack mixes fully free public products with limited free plans. The table labels the access model and the verified limit for each. Meta Ad Library covers live competitor ads, and Google Ads Transparency Center covers ads served over a chosen period. Visualping's free plan covers change alerts on 5 competitor pages. Semrush's free account covers 10 keyword or domain reports a day. Similarweb's free tier covers traffic trends. Google Alerts covers brand mentions, and Owler Community plus Crunchbase's free account add funding and leadership news.
| CI job | Free tool | Access model and verified limit (July 21, 2026) |
|---|---|---|
| Competitor ads on Meta, Google, and YouTube | Meta Ad Library, Google Ads Transparency Center | Fully free, no account. Meta focuses on active ads; Google shows ads served in a chosen period. Spend data is limited outside political categories. |
| Page changes: pricing, product, careers, changelogs | Visualping Free | Free plan. 5 pages, 150 checks/mo, AI summaries, email + webhook alerts, API. |
| Keywords and backlinks | Semrush Free | Free account. 10 reports/day, 1 project, truncated result sets. |
| PPC history spot checks | SpyFu Free | Free account. Unlimited searches, roughly 5 rows per report. |
| Traffic benchmarking | Similarweb Free | Free account. 3 months of history, 5 results per report. |
| Brand mentions | Google Alerts | Fully free, Google account. Up to 1,000 alerts per account on indexed content. |
| Funding and leadership news | Owler Community, Crunchbase free | Free accounts. Owler: follow 5 companies, 1 profile view + 1 digest/mo. Crunchbase: profiles, 5 results per search, alerts on one list. |
| Social account benchmarking | Social Blade Free | Most stats without login (Instagram requires a free account); 5 saved favorites per platform. |
| Search demand | Google Trends | Fully free, no account. Relative data only. |
What has no free path: Klue, Crayon, AlphaSense, and Contify sell through sales teams with no self-serve tier. Ahrefs limits free access to your own site. When one of those is the right tool for the job, we say so below and give the real price floor.
How we picked these 15 competitive intelligence tools
We set four filters before the shortlist. Each tool had to be active: still sold and supported as a standalone product, with no shutdown in the past 18 months. Each had to cover at least one CI job, like pricing, SEO, ads, funding, or product changes. Each had to show pricing or a credible public price floor. And each had to work for teams outside the Fortune 500: where pricing is quote-only, a credible public benchmark had to exist.
From there we weighed three things. First, feature depth. We scored each tool against a checklist of 24 CI jobs, from pricing alerts to share-of-voice analysis to win/loss tagging. Second, customer review signal. We pulled G2, TrustRadius, and Capterra. We set a cutoff of 3.8 stars across 50 or more reviews. Third, distinct positioning. Tools that collapsed into the same feature set as another tool on the list got cut. Exception: if the positioning was meaningfully different. For more on what sources a CI practitioner should pull from, see our guide to competitive intelligence sources.
Prices move faster than roundups get refreshed, so we re-verify instead of trusting our own archive. Free-tier limits and public list prices in this guide were checked against vendor pricing pages on July 21, 2026. Quote-only platforms (Klue, Crayon, AlphaSense, Contify) qualify for the list because public benchmarks give a credible price floor; those ranges are labeled estimates, since the vendors publish no list price. Where a vendor runs a first-month or first-year promo, we list the ongoing price: SpyFu advertises $59 for the first month of its Pro plan, then bills $119, and Crunchbase's $49 checkout rate rises to $79 after the first year.
This guide draws on three things. Visualping's own data from a sample of 1.78 million active monitors. Public work from CI practitioners including April Dunford and Andy McCotter-Bicknell. And category research: Crayon's vendor-sponsored 2025 State of Competitive Intelligence survey and the independent Forrester Wave on CI Platforms, Q4 2024, which rated 11 vendors.
One pattern from our data shaped the guide. Ownership shifts sharply by content type. In a Visualping sample, 76% of investor-relations monitors sit on business workspaces. So do 75% of legal and terms-of-service monitors. But 86% of job-page monitors sit on personal accounts. CI runs inside companies. Job hunting runs inside individuals. The tool categories below map to that split.
Disclosure
Visualping is our product. We built a tool that watches webpages for changes and sends alerts when those pages move. That covers one slice of competitive intelligence. Other slices live outside what Visualping does. Here are the specific handoffs:
- Battlecards, win/loss, and sales enablement: Klue and Crayon are built for product marketing teams. They push competitive content into Salesforce, Gong, and Slack. Visualping does not build battlecards.
- Enterprise financial research: AlphaSense indexes SEC filings, broker research, and premium news. Continuous market monitoring for mid-market teams: Contify centralizes competitor and market tracking with dashboards and newsletters. Visualping tracks what is on a webpage.
- Keyword gaps, backlinks, and search share: Semrush, Ahrefs, and SpyFu own this category. Visualping has no crawler, no keyword database, and no rank tracker.
- Searching competitor ad creative on demand: Meta Ad Library and Google Ads Transparency Center are free and direct. They are the right tools to browse what a competitor is running or recently ran. What neither one does is send alerts when the ad list changes. Visualping fills that gap. Point a monitor at a competitor's Meta Ad Library page or their Google Ads Transparency advertiser page. You get an email or webhook alert after the next scheduled check catches the change. That is how product marketing teams hear about competitor campaign launches within a day instead of at the next manual audit.
Visualping's job in a CI stack is URL-scale page change monitoring. Every change comes with a visual diff and an AI summary. The scope goes well past pricing. You can watch homepages for positioning shifts. Product and features pages. Blog and press rooms. Investor relations and SEC filings. Sitemaps, to catch new URLs as competitors publish them. Meta and Google ad-library pages, to hear about new campaign launches within a day. Legal, terms, and compliance updates. Full-page visual regression on the URLs you choose. If a page is public and reachable, you can put a monitor on it. See each tool's Limitations section below, including Visualping's, for the honest caveats.
"Most competitive intel 'teams' are teams of one." Andy McCotter-Bicknell, Lead Product Marketing Manager, AI, MCP, Automations at Apollo.io
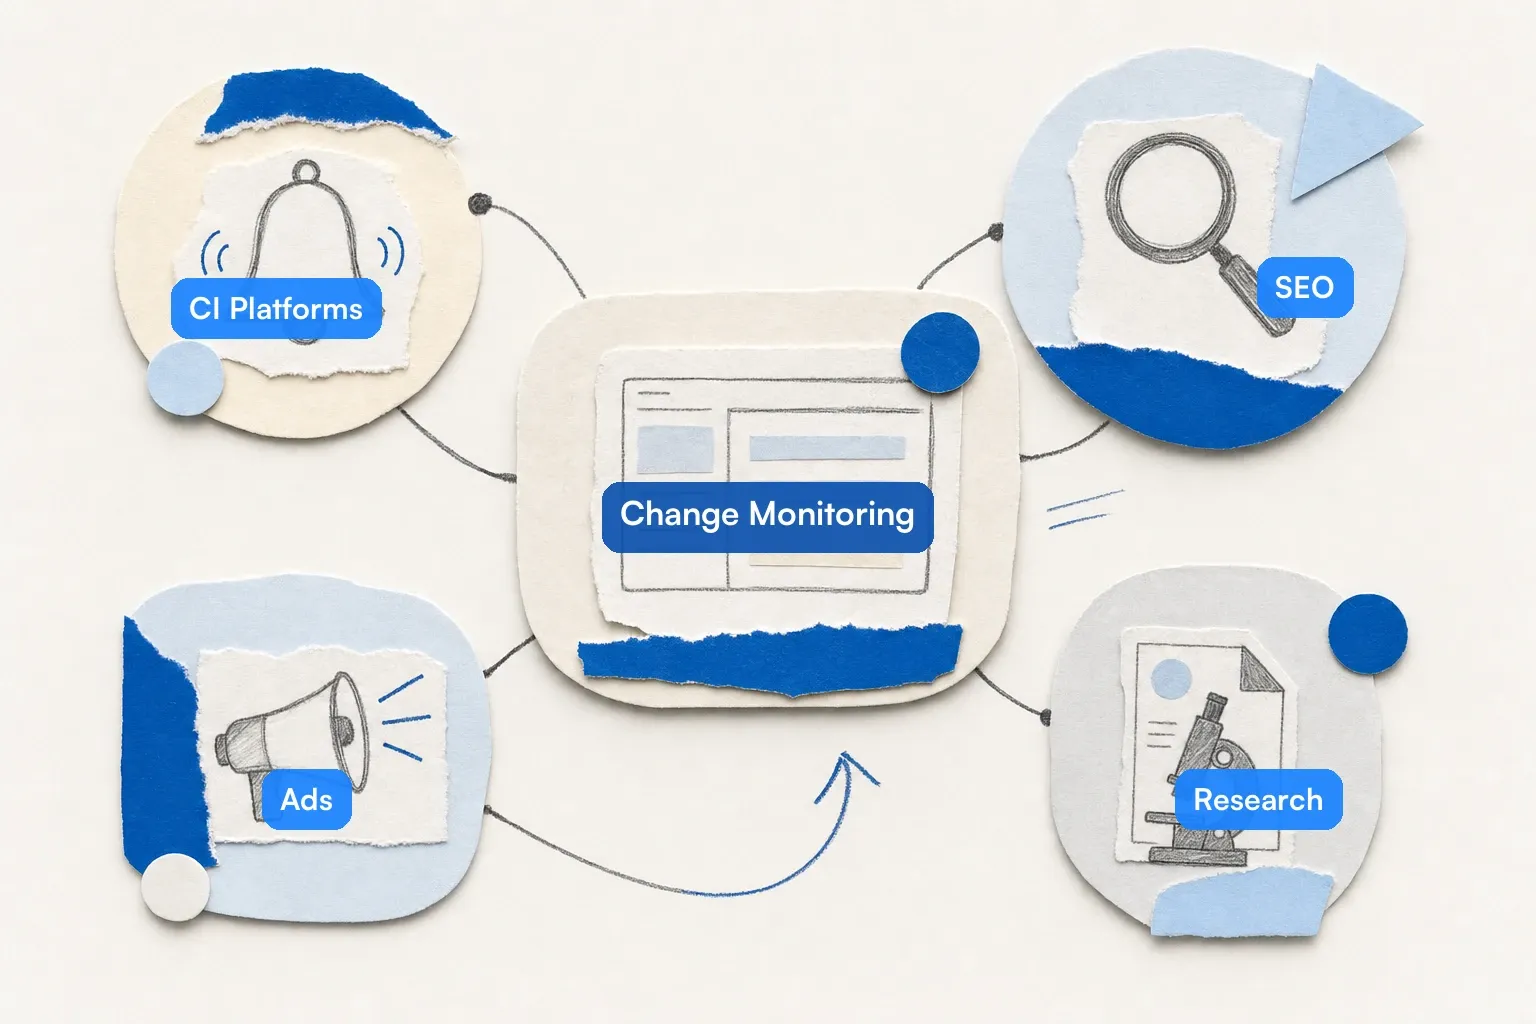 Competitive intelligence tools group into five category clusters by what they track
What are competitive intelligence tools?
Competitive intelligence tools are software that collects, analyzes, and distributes information about competitors so a team can make faster decisions about pricing, product, sales, and marketing. The category covers five distinct jobs.
- All-in-one CI platforms like Klue, Crayon, Contify, and AlphaSense centralize competitor signal feeds for product marketing and analyst teams; Klue and Crayon add battlecard and win/loss workflows.
- Website and change monitoring tools like Visualping watch competitor pricing pages, product pages, careers pages, changelogs, and ad-library pages, and alert the team when something moves.
- SEO and keyword intelligence tools like Semrush, Ahrefs, SpyFu, and Similarweb expose what competitors rank for, who links to them, and how their organic and paid traffic breaks down.
- Ad and social monitoring tools like Meta Ad Library, Google Ads Transparency Center, and Social Blade reveal competitor ad creative and social presence across platforms.
- Company research tools like Owler, Crunchbase, Google Alerts, and Google Trends catch funding rounds, leadership hires, M&A activity, and brand-mention spikes.
Most CI teams use three to five tools, not one. The right question to ask is which tool wins each job. The 15 tools below are mapped to those five categories.
Website and change monitoring
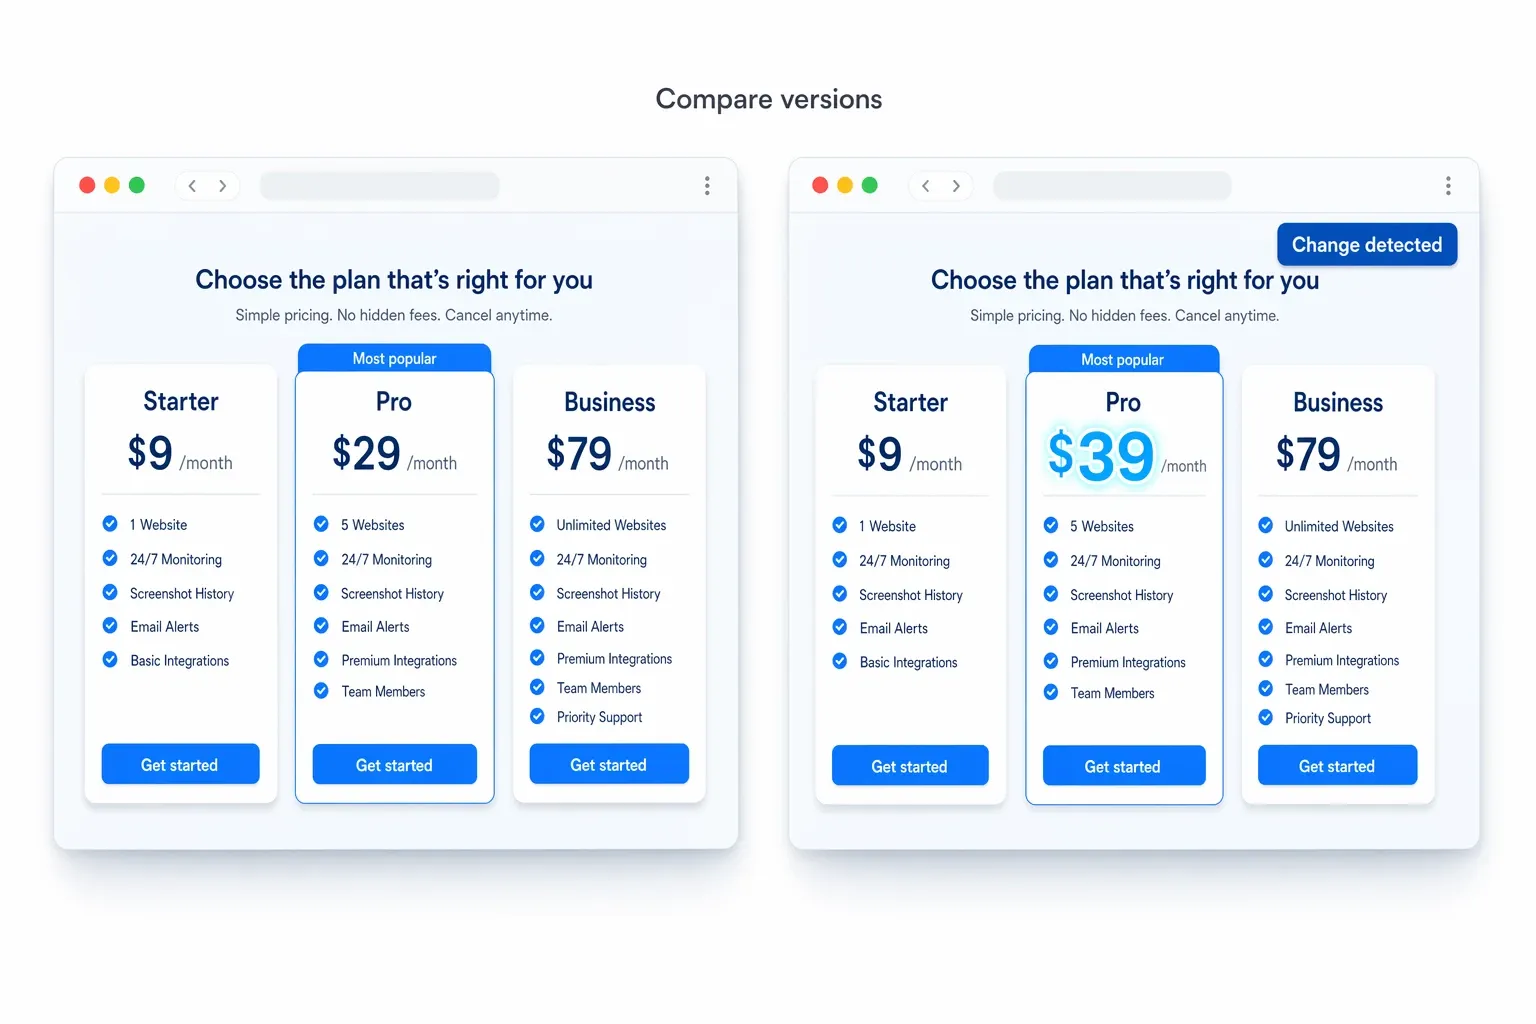 Side-by-side diff shows a competitor pricing page before and after a detected change
This category is narrow on purpose: it covers the slice Visualping is built for, URL-scale webpage change monitoring across hundreds or thousands of pages.
Visualping - Website change monitoring and AI change alerts
Visualping watches accessible public URLs and sends an alert when a page changes. That includes pricing pages, product pages, blog posts, legal docs, landing pages, SEC filings, government announcements, and social profiles. Every alert comes with three things. A side-by-side visual diff. A binary IMPORTANT flag from Visualping AI. A plain-language summary of what changed.
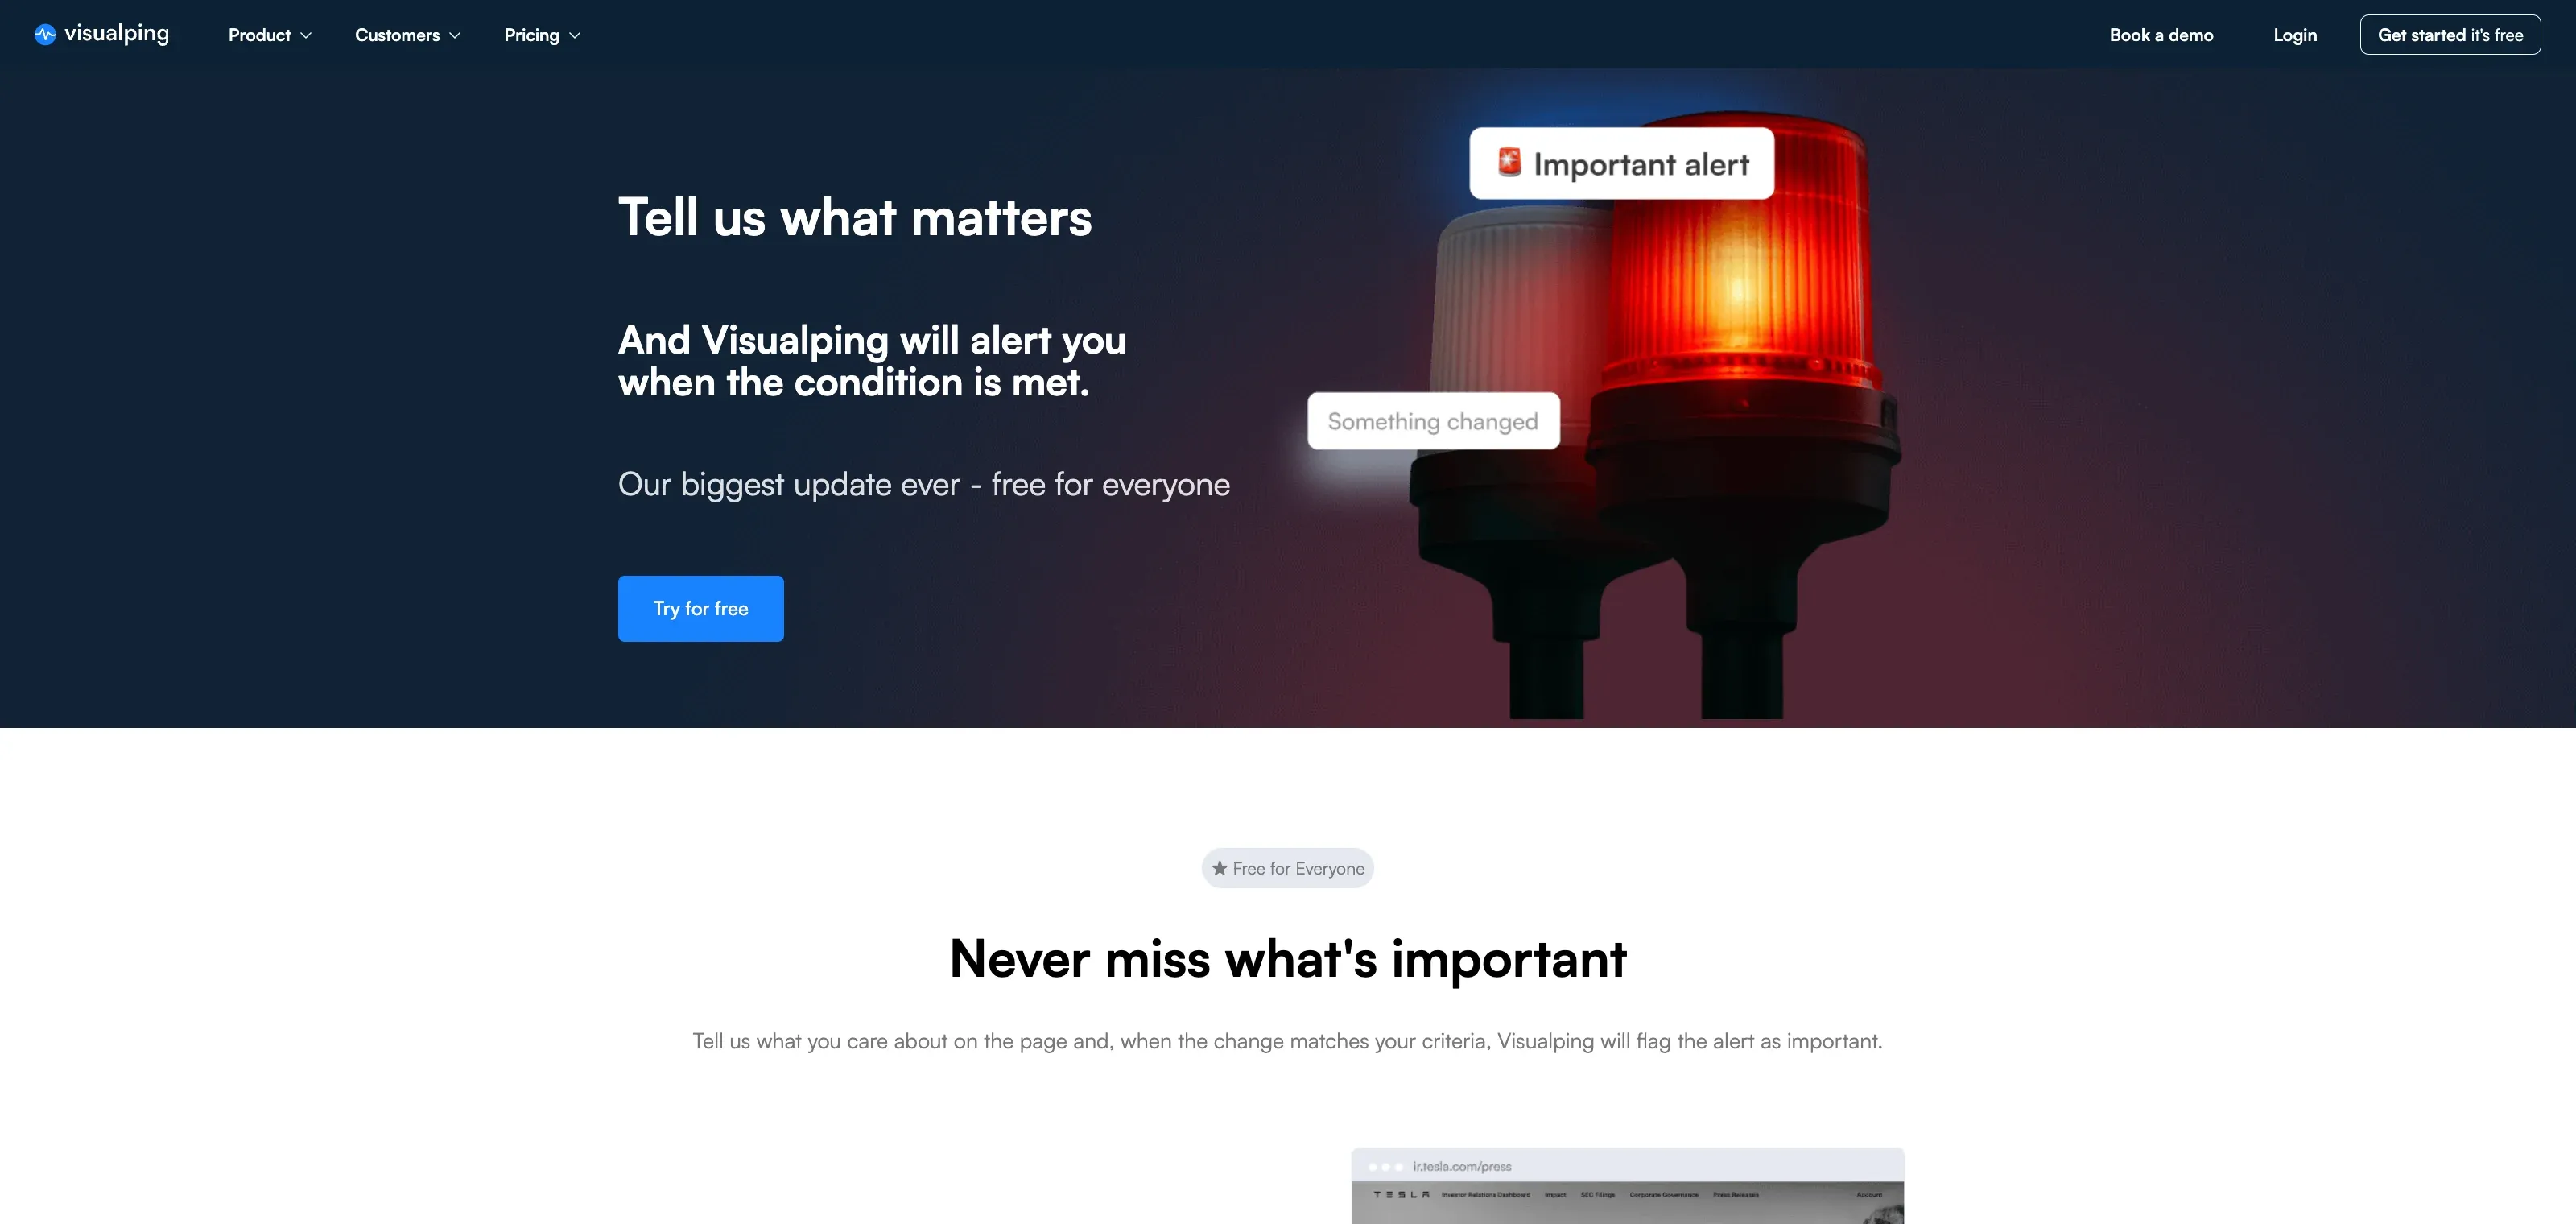 Visualping AI classifies and summarizes every change event on monitored pages
In a sample of active Visualping monitors as of April 2026, 9,705 are watching competitor pricing or plans pages. The median check interval runs every 2.8 hours. That is about 10 times faster than the platform default. In a 30-day window, 42% of those monitors detected at least one change. A monthly review learns about those changes weeks late and misses any that revert in between. For which specific pricing pages move, see the SaaS pricing pages callout below.
Best for: Teams tracking URL-level changes on competitor websites, pricing pages, or regulatory sources at scale. Works across in-house CI, product marketing, sales, legal, and compliance.
What it does well:
- Monitor hundreds to thousands of URLs on schedules from every 2 minutes on top tiers to monthly
- AI summarization and importance flags on every change event
- Visual diff, text diff, and element-level monitoring on the same URL
- API access on all plans, including Free
Limitations:
- Not a battlecard tool. Does not generate sales enablement content.
- Does not analyze keyword, backlink, or traffic data (see Semrush, Ahrefs, Similarweb)
- Login-protected pages need custom Actions or Scripts
- Free plan caps at 150 checks per month (5 competitor pages on a daily cadence)
Pricing: Free plan includes 5 pages, 150 checks per month, and API access. Paid plans start at $10 per month on an annual plan (Personal tier). Plans scale into thousands of URLs for Business and Solutions tiers.
SEO tools that track competitor keywords and backlinks
SEO-specific competitor intelligence is its own discipline. These four tools show what competitors rank for, who links to them, how their traffic breaks down, and where the keyword gaps are.
Semrush - SEO, PPC, and content intelligence
Semrush covers the widest surface among the SEO tools here (Adobe completed its acquisition of Semrush in April 2026; the product is still sold standalone): organic search, paid search, backlinks, content gap analysis, site audits, and local SEO in one platform. For CI specifically, two modules earn the subscription: Keyword Gap and Backlink Gap. Traffic Analytics lives in the separate Traffic & Market toolkit, priced on its own.
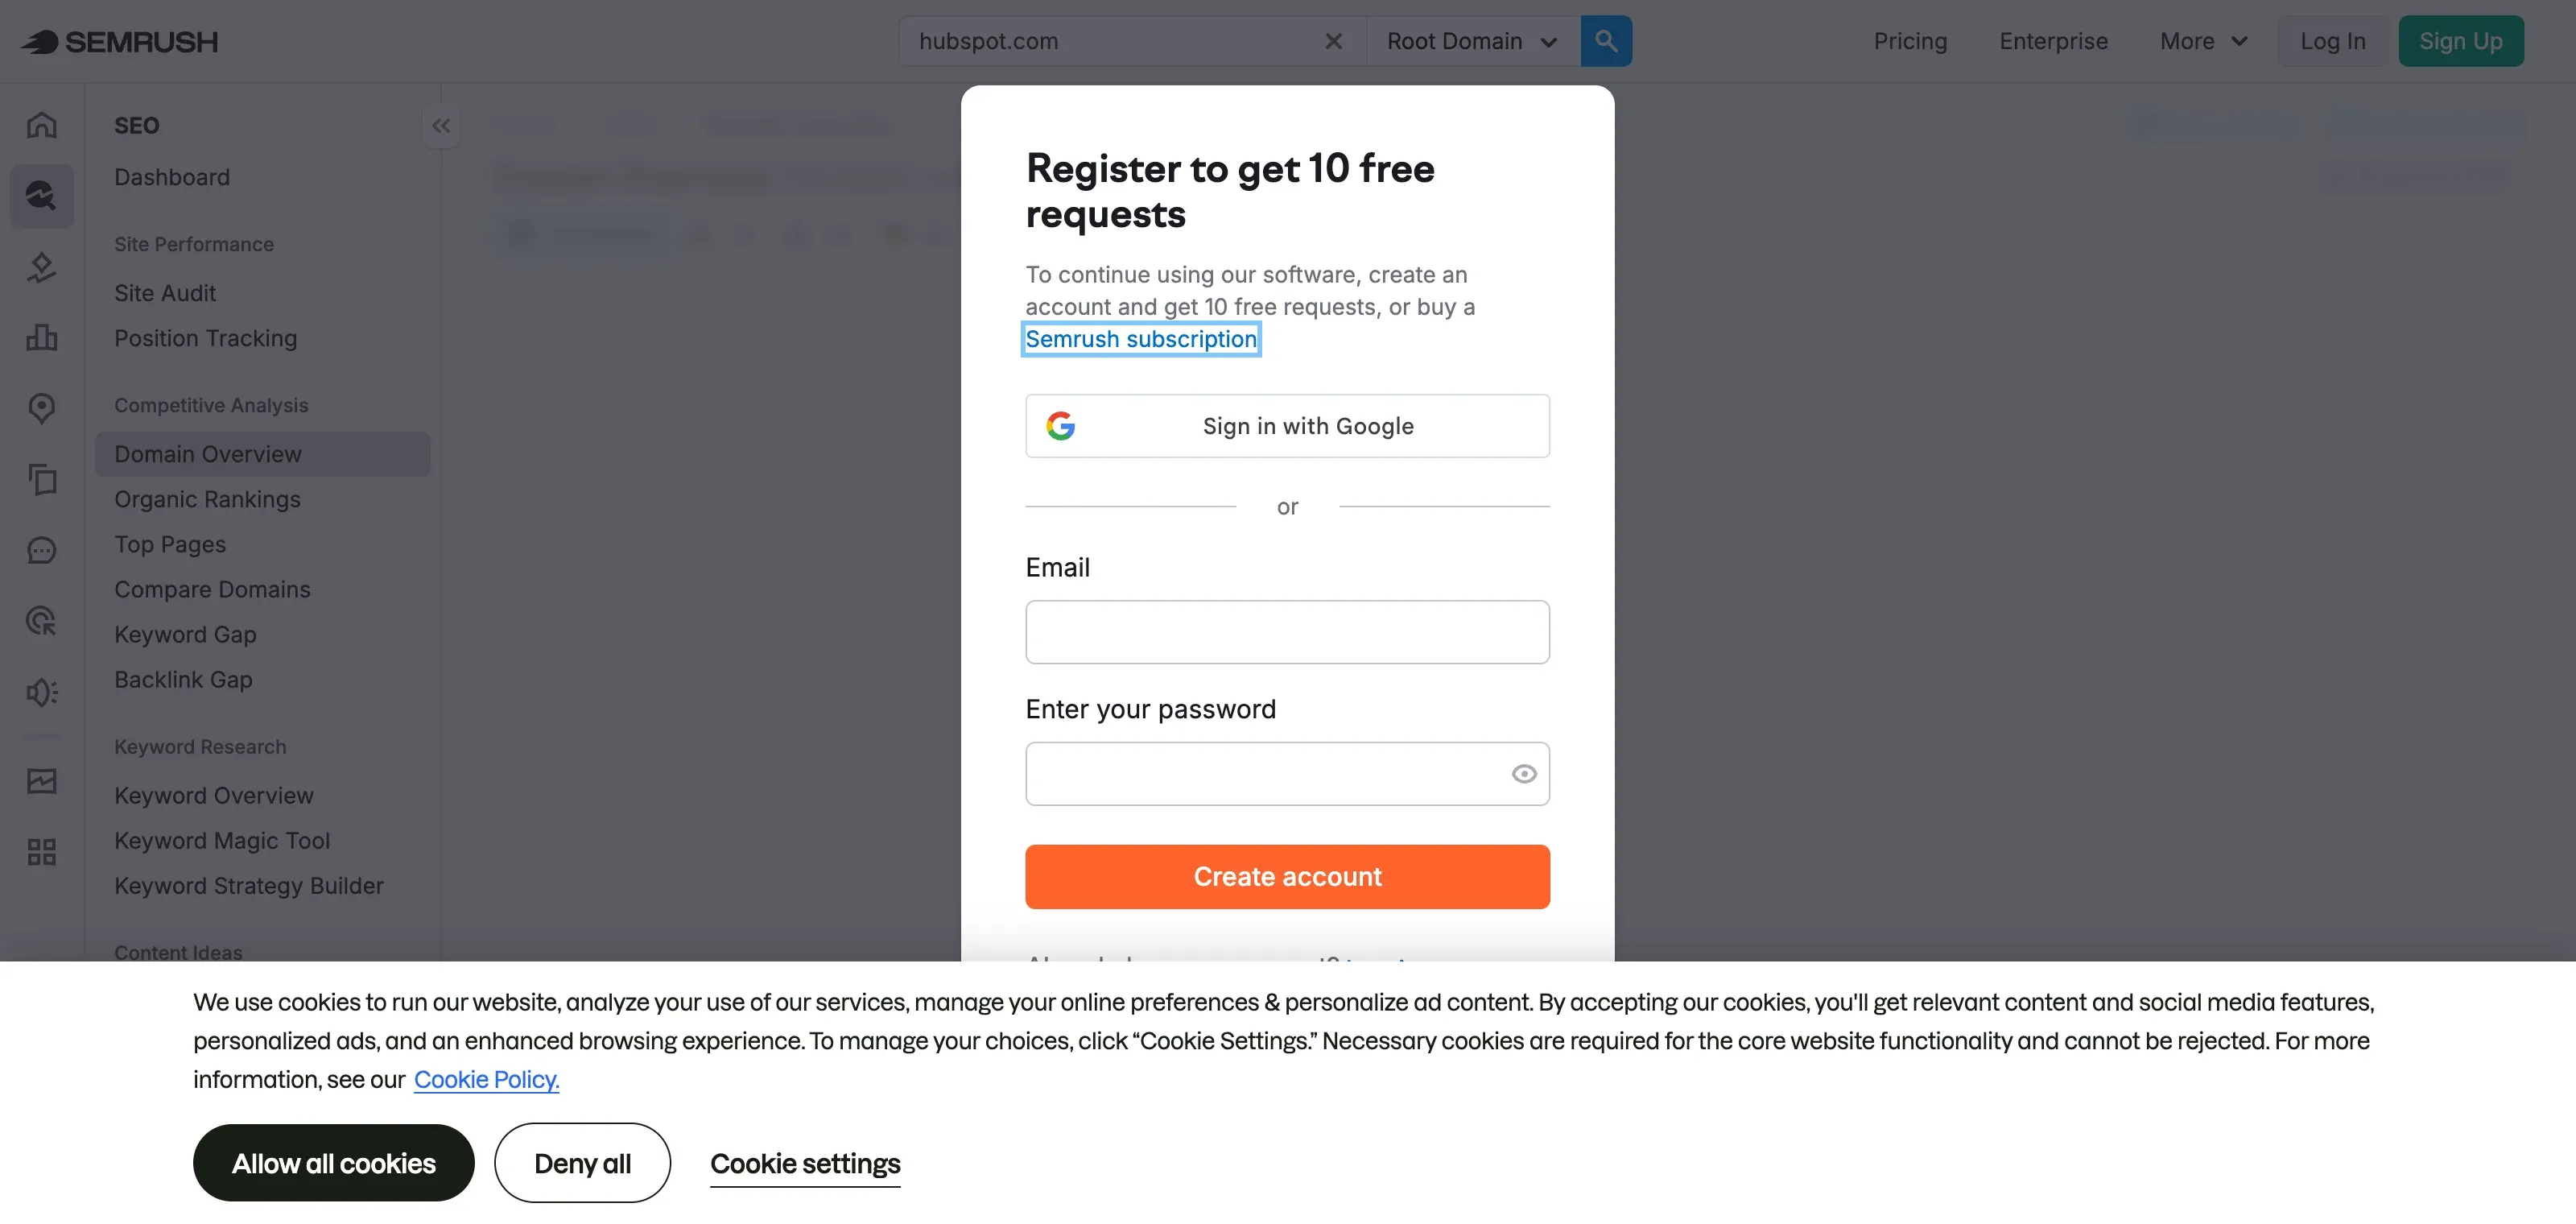 Semrush's domain overview surfaces traffic, keywords, and authority in one view
Free tier: $0 account with 10 reports per day across the core tools, 1 project, and truncated result sets. Enough for spot checks. Sustained research hits the daily cap fast.
Best for: SEO teams, content marketers, and agencies that need a single platform for organic, paid, and content competitive analysis.
What it does well:
- Keyword Gap shows what competitors rank for that you do not
- Traffic Analytics estimates competitor traffic by channel and country (separate Traffic & Market toolkit, from $289/mo billed annually)
- Position Tracking monitors rank changes across a tracked keyword set
Limitations:
- Semrush sells two parallel plan families in 2026: SEO Classic (Pro, Guru, Business) and Semrush One, which adds AI Visibility tracking to each tier. Picking between them adds a step to the buying decision.
- Free tier capped at 10 reports per day
- Traffic estimates vary against platforms like Similarweb. Use as a directional signal.
Pricing: Free account with 10 reports per day. SEO Classic starts at $139.95 per month (Pro), or $117.33 per month billed annually. The Semrush One family, which adds AI Visibility tracking, starts at $199 per month ($165.17 billed annually) and steps to $299 and $549.
Similarweb - Traffic and engagement benchmarking
Similarweb is the default traffic estimation tool for most CI analysts. The free version is enough for high-level traffic comparisons across a handful of competitors. Higher packages add longer history, audience overlap, and keyword-level detail; the $125 entry package keeps the same 3-month window as Free.
Free tier: 3 months of traffic history and 5 results per report, with no API or exports. Good for a pulse check on a handful of competitors.
Best for: Analysts, strategy teams, and media teams benchmarking competitor traffic, audience sources, and engagement metrics.
What it does well:
- Traffic estimates by channel, country, and device for any public domain
- Audience overlap analysis for understanding shared user bases
- App intelligence for mobile competitive analysis
Limitations:
- Free plan caps at 3 months of history and 5 results per report, with no exports
- Smaller domains produce thin data. Similarweb needs meaningful traffic to estimate reliably.
- Enterprise pricing is opaque, typically six figures for full access
Pricing: Free includes 3 months of data. The self-serve Competitive Intelligence package starts at $125 per month billed annually, or $199 month to month, for one user and the same 3 months of history. More history requires a higher package, and business tiers are quote-based.
SpyFu - PPC and SEO history for Google Ads
SpyFu's niche is competitor PPC history. It shows the Google Ads keywords it has observed a domain bidding on, and the ad copy variants it has captured. Run duration works as a directional signal of what performs. SpyFu samples search results rather than guaranteeing a complete record. The SEO side of SpyFu is fine but secondary. This is a tool PPC teams buy.
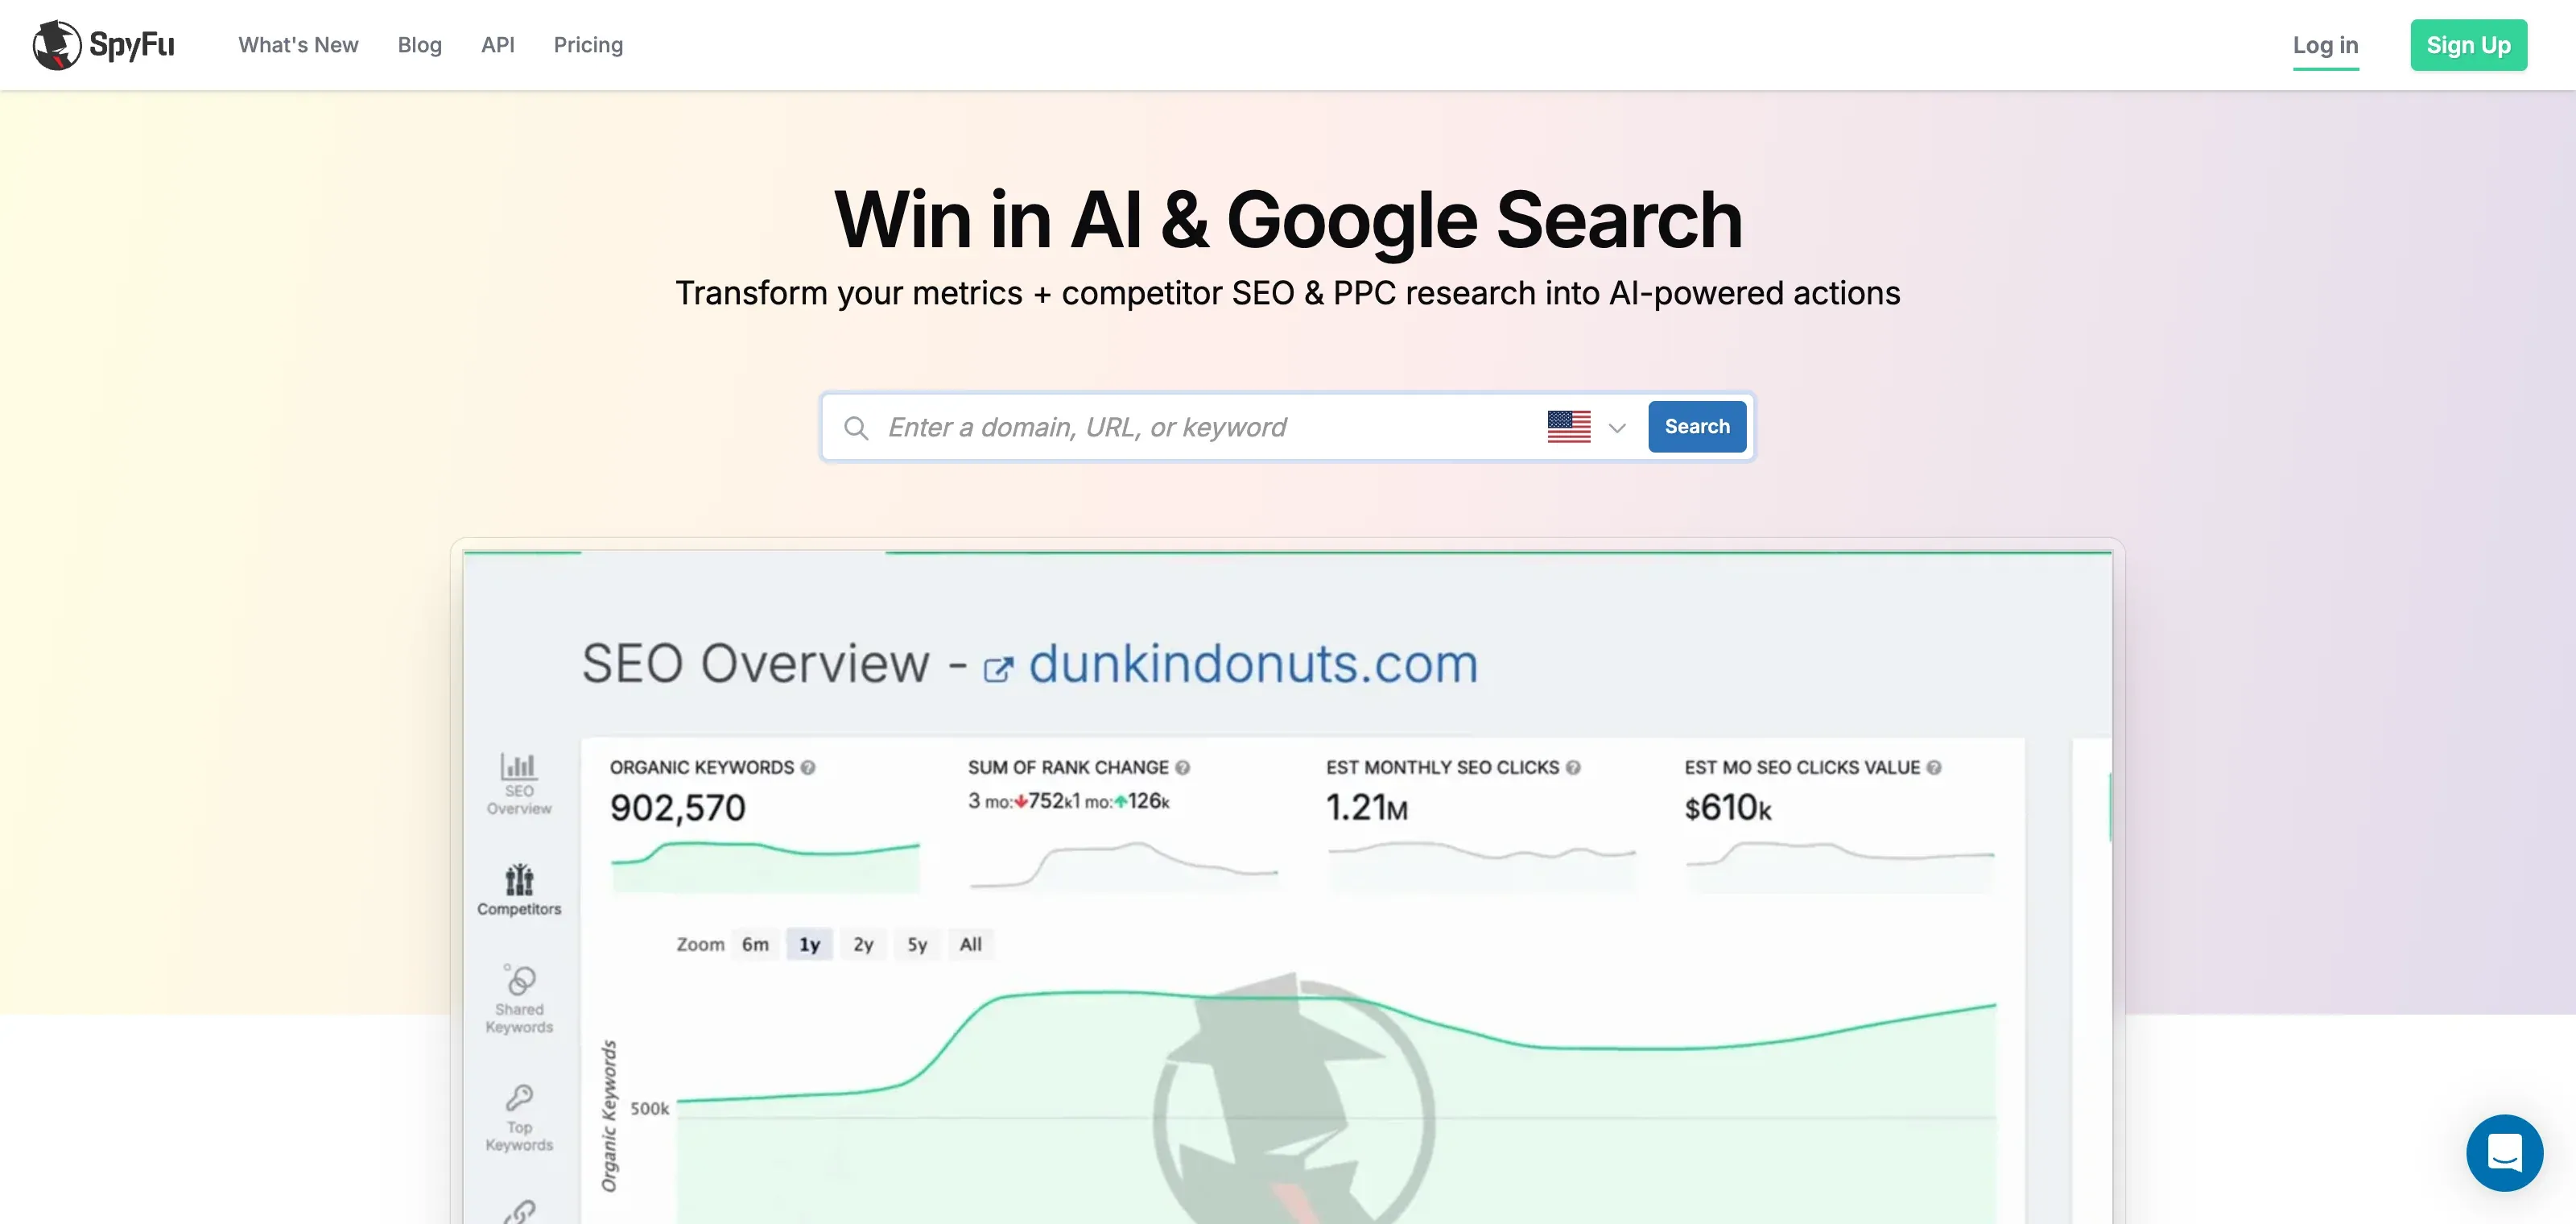 SpyFu's niche: historical Google Ads keyword and copy data
Free tier: A free account (email registration) allows unlimited searches with truncated results, roughly 5 rows per report. Enough to scout a domain. Full data needs a plan.
Best for: PPC managers and growth marketers reverse-engineering competitor Google Ads strategy.
What it does well:
- Historical ad copy archive with run duration as a proxy for performance
- PPC keyword overlap and gap analysis
- Competitive Kombat feature for head-to-head comparisons
Limitations:
- Data quality outside the United States is uneven
- SEO tools are less comprehensive than Semrush or Ahrefs
- Free version truncates every report to a handful of rows
Pricing: Basic runs $39 per month, or $29 per month billed annually. Pro + AI runs $119 per month ($89 annual). Watch the checkout: the advertised $59 Pro price covers the first month only, then bills $119. Basic also lacks the 10-plus-year ad history; the historical archive this section recommends starts with Pro + AI at $89 per month billed annually.
Ahrefs - Backlinks and SEO competitive depth
Ahrefs is the backlink specialist among SEO tools. For CI, Site Explorer shows three things. Who is linking to a competitor. What pages on their site earn the most backlinks. And how their organic traffic tracks against yours. Content Explorer (Standard plan and up) adds room for content-angle research. If you pair Ahrefs with other SEO monitoring tools, the overlap sits on keywords and backlinks, not page-level changes.
Free tier: None for competitor analysis. The Ahrefs Free plan covers your own verified site, and the standalone free SEO tools handle one-off lookups.
Best for: SEO teams focused on link building, content strategy, and organic competitive analysis.
What it does well:
- Backlink index depth is the core strength, consistently ranked at or near the top of independent index-size comparisons
- Site Explorer and Keywords Explorer cover the core SEO competitive jobs; Content Explorer joins at Standard ($249)
- Ahrefs Free (the successor to Webmaster Tools) covers your own verified site at no cost
Limitations:
- No permanent free tier for competitor analysis. Webmaster Tools covers your own site only.
- The $29 Starter plan trims history to about a month and caps usage, so sustained competitor research still needs Lite or higher
- Weaker than Semrush for paid search and advertising data
Pricing: The new Starter plan runs $29 per month with tight usage caps. Full plans start at $129 per month (Lite), $249 (Standard), $449 (Advanced).
If a page-change monitor would round out your SEO stack, set one up in 90 seconds. Visualping adds scheduled push alerts with visual diffs on the exact URLs you pick, a different job from crawl-based SEO snapshots. It pairs cleanly with Semrush or Ahrefs for full-funnel coverage.
Free ad libraries and social benchmarking tools
 Social ad intelligence means tracking creative across multiple platforms
These three tools are the default ad and social spying stack. Meta and Google maintain the first two themselves and require no account. Social Blade shows most stats without login, and requires a free account for Instagram data and saved favorites.
Meta Ad Library - Facebook and Instagram ad intelligence
Meta Ad Library is Meta's transparency tool. It lists every active Facebook and Instagram ad a Page is running. For CI, it is the first stop for free competitor ad research. You get competitor ad creative, cadence, and targeting geography. The gap is alerting. Meta does not tell you when a competitor publishes a new ad. Most product marketers solve this by pairing the Ad Library with a page-change monitor. Point it at a competitor's Ad Library page. On a daily check, new campaign launches surface within a day. You can also monitor Facebook pages for non-ad changes, like pinned posts, bios, and profile updates.
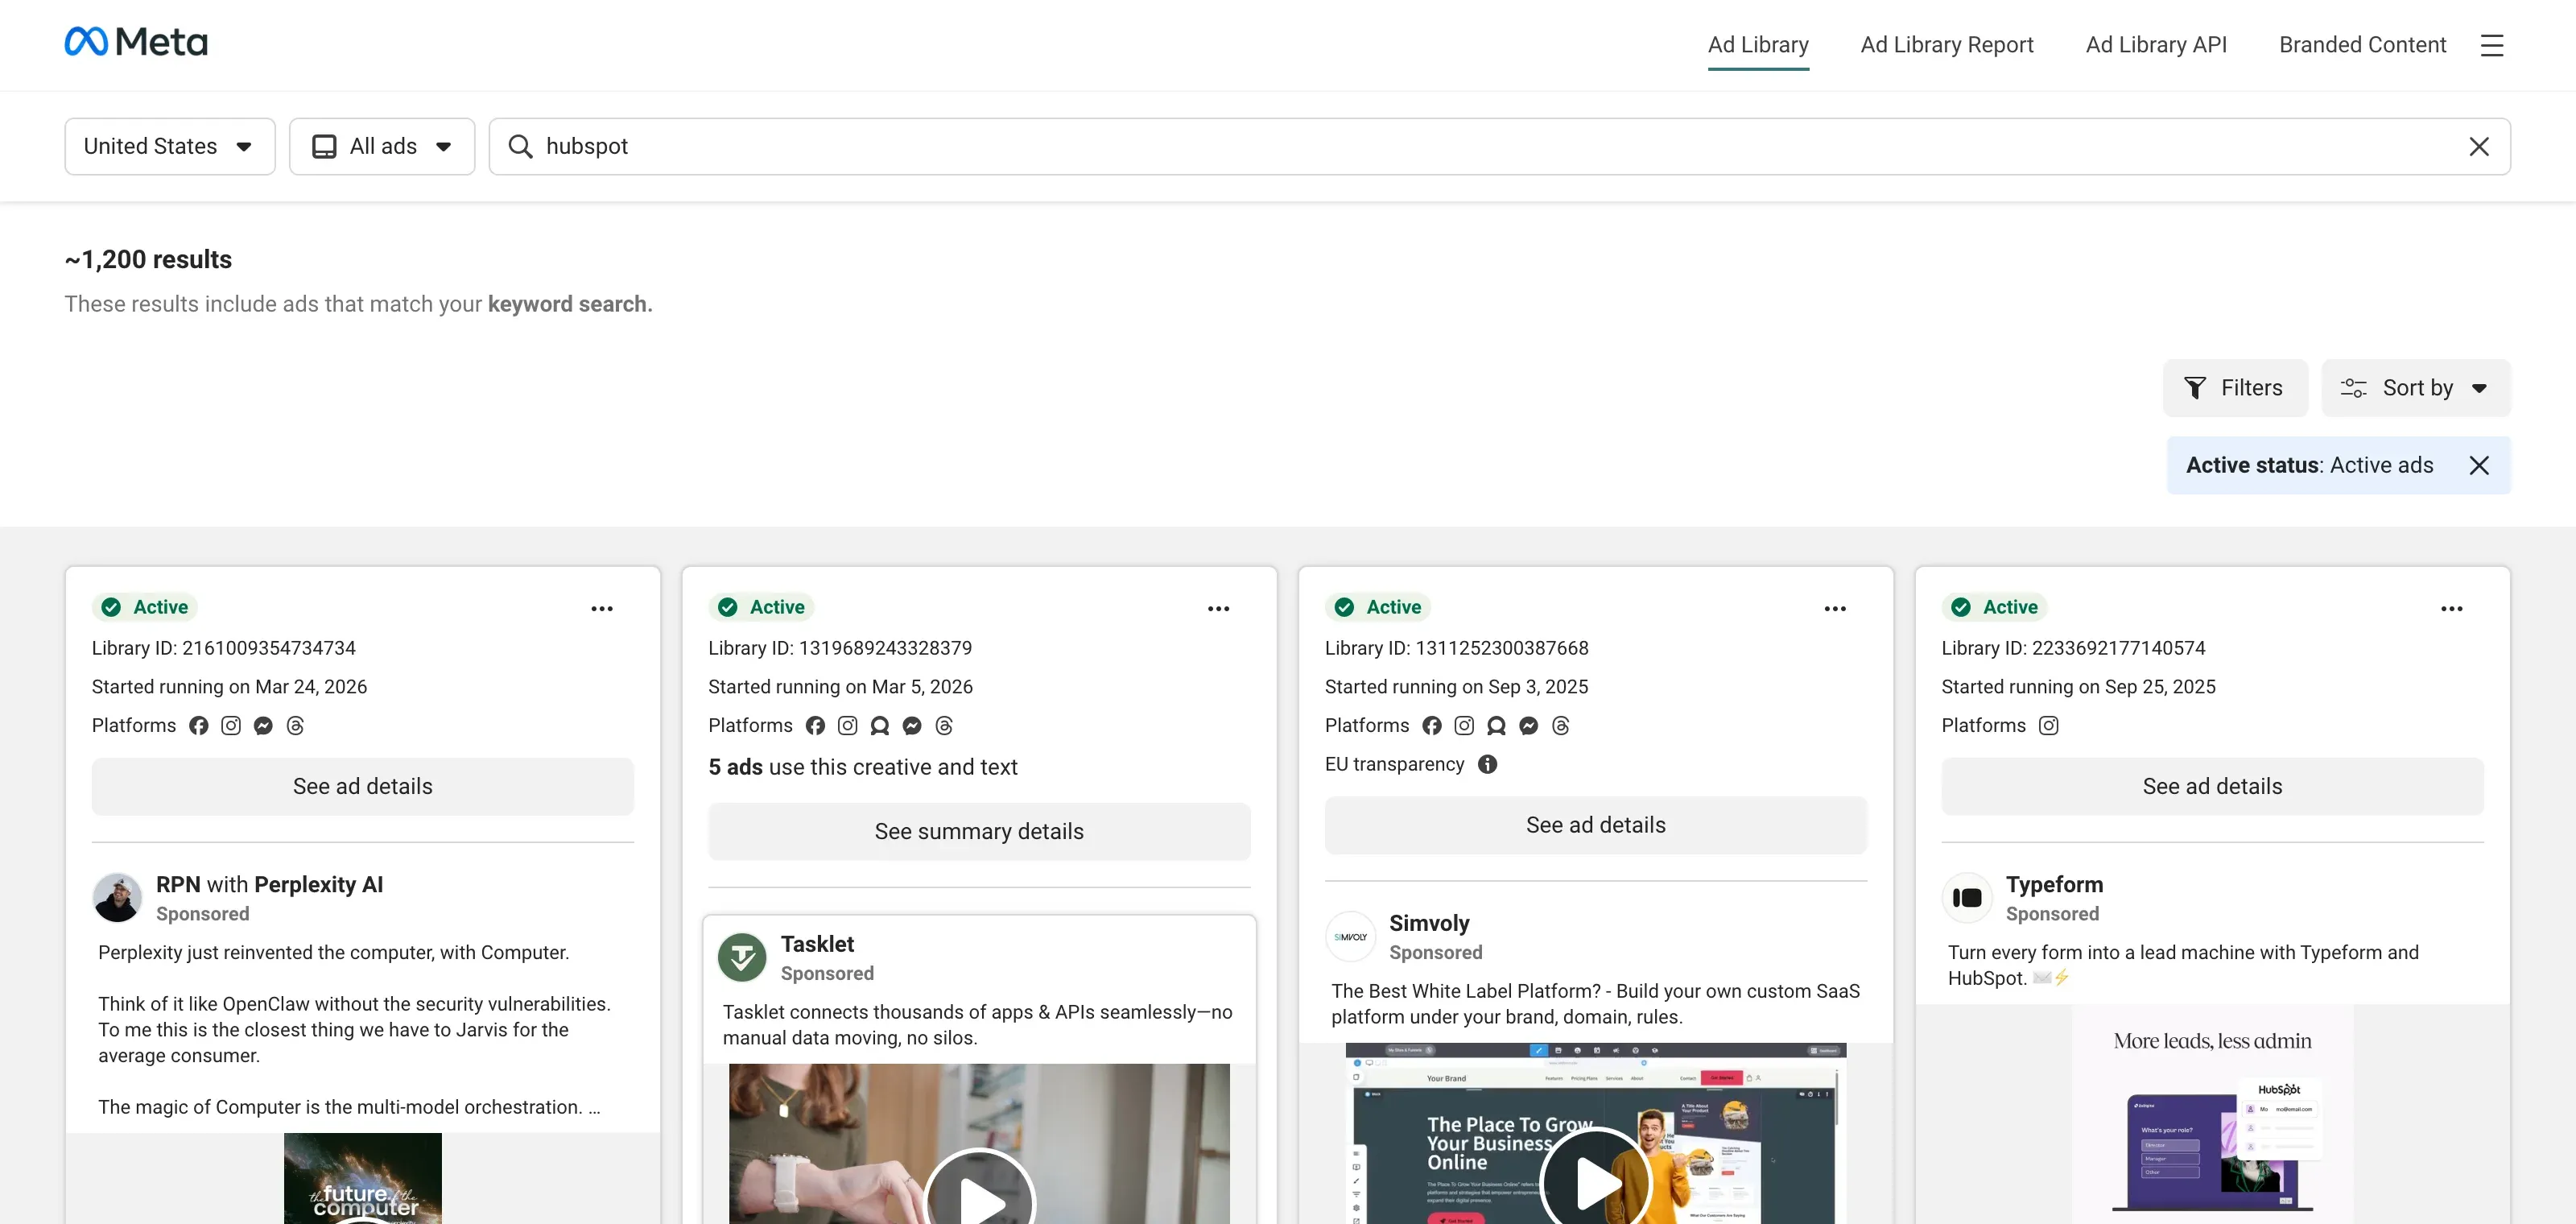 Meta Ad Library lists every active Facebook and Instagram ad a Page is running
Free tier: The whole tool. No account, no caps.
Best for: Social media managers, paid social marketers, and brand strategists tracking competitor Facebook and Instagram ads.
What it does well:
- Every active ad on any Meta Page, searchable by keyword
- Ad start date, platforms, and reach estimates for political and social issue ads
- Creative-level view of what competitors are testing
Limitations:
- For most commercial ads outside the EU, the library focuses on active creatives. EU-targeted ads are retained for one year, political and social-issue ads for seven.
- Most commercial ads outside the EU show creative without spend or reach estimates; EU-served ads add targeting and delivery transparency
- Does not cover LinkedIn, TikTok, or X
Pricing: Free.
Google Ads Transparency Center - Search and display ad intelligence
Google Ads Transparency Center shows the ads an advertiser has served across Google Search, Display, Shopping, and YouTube over a selectable date range. It is the Google version of Meta Ad Library, at the creative level SpyFu's keyword focus skips. Same caveat as Meta's tool. It is a searchable catalog, not an alerting system. Point a page monitor at a competitor's Transparency Center advertiser page, and a daily check surfaces new Search or YouTube campaigns within a day.
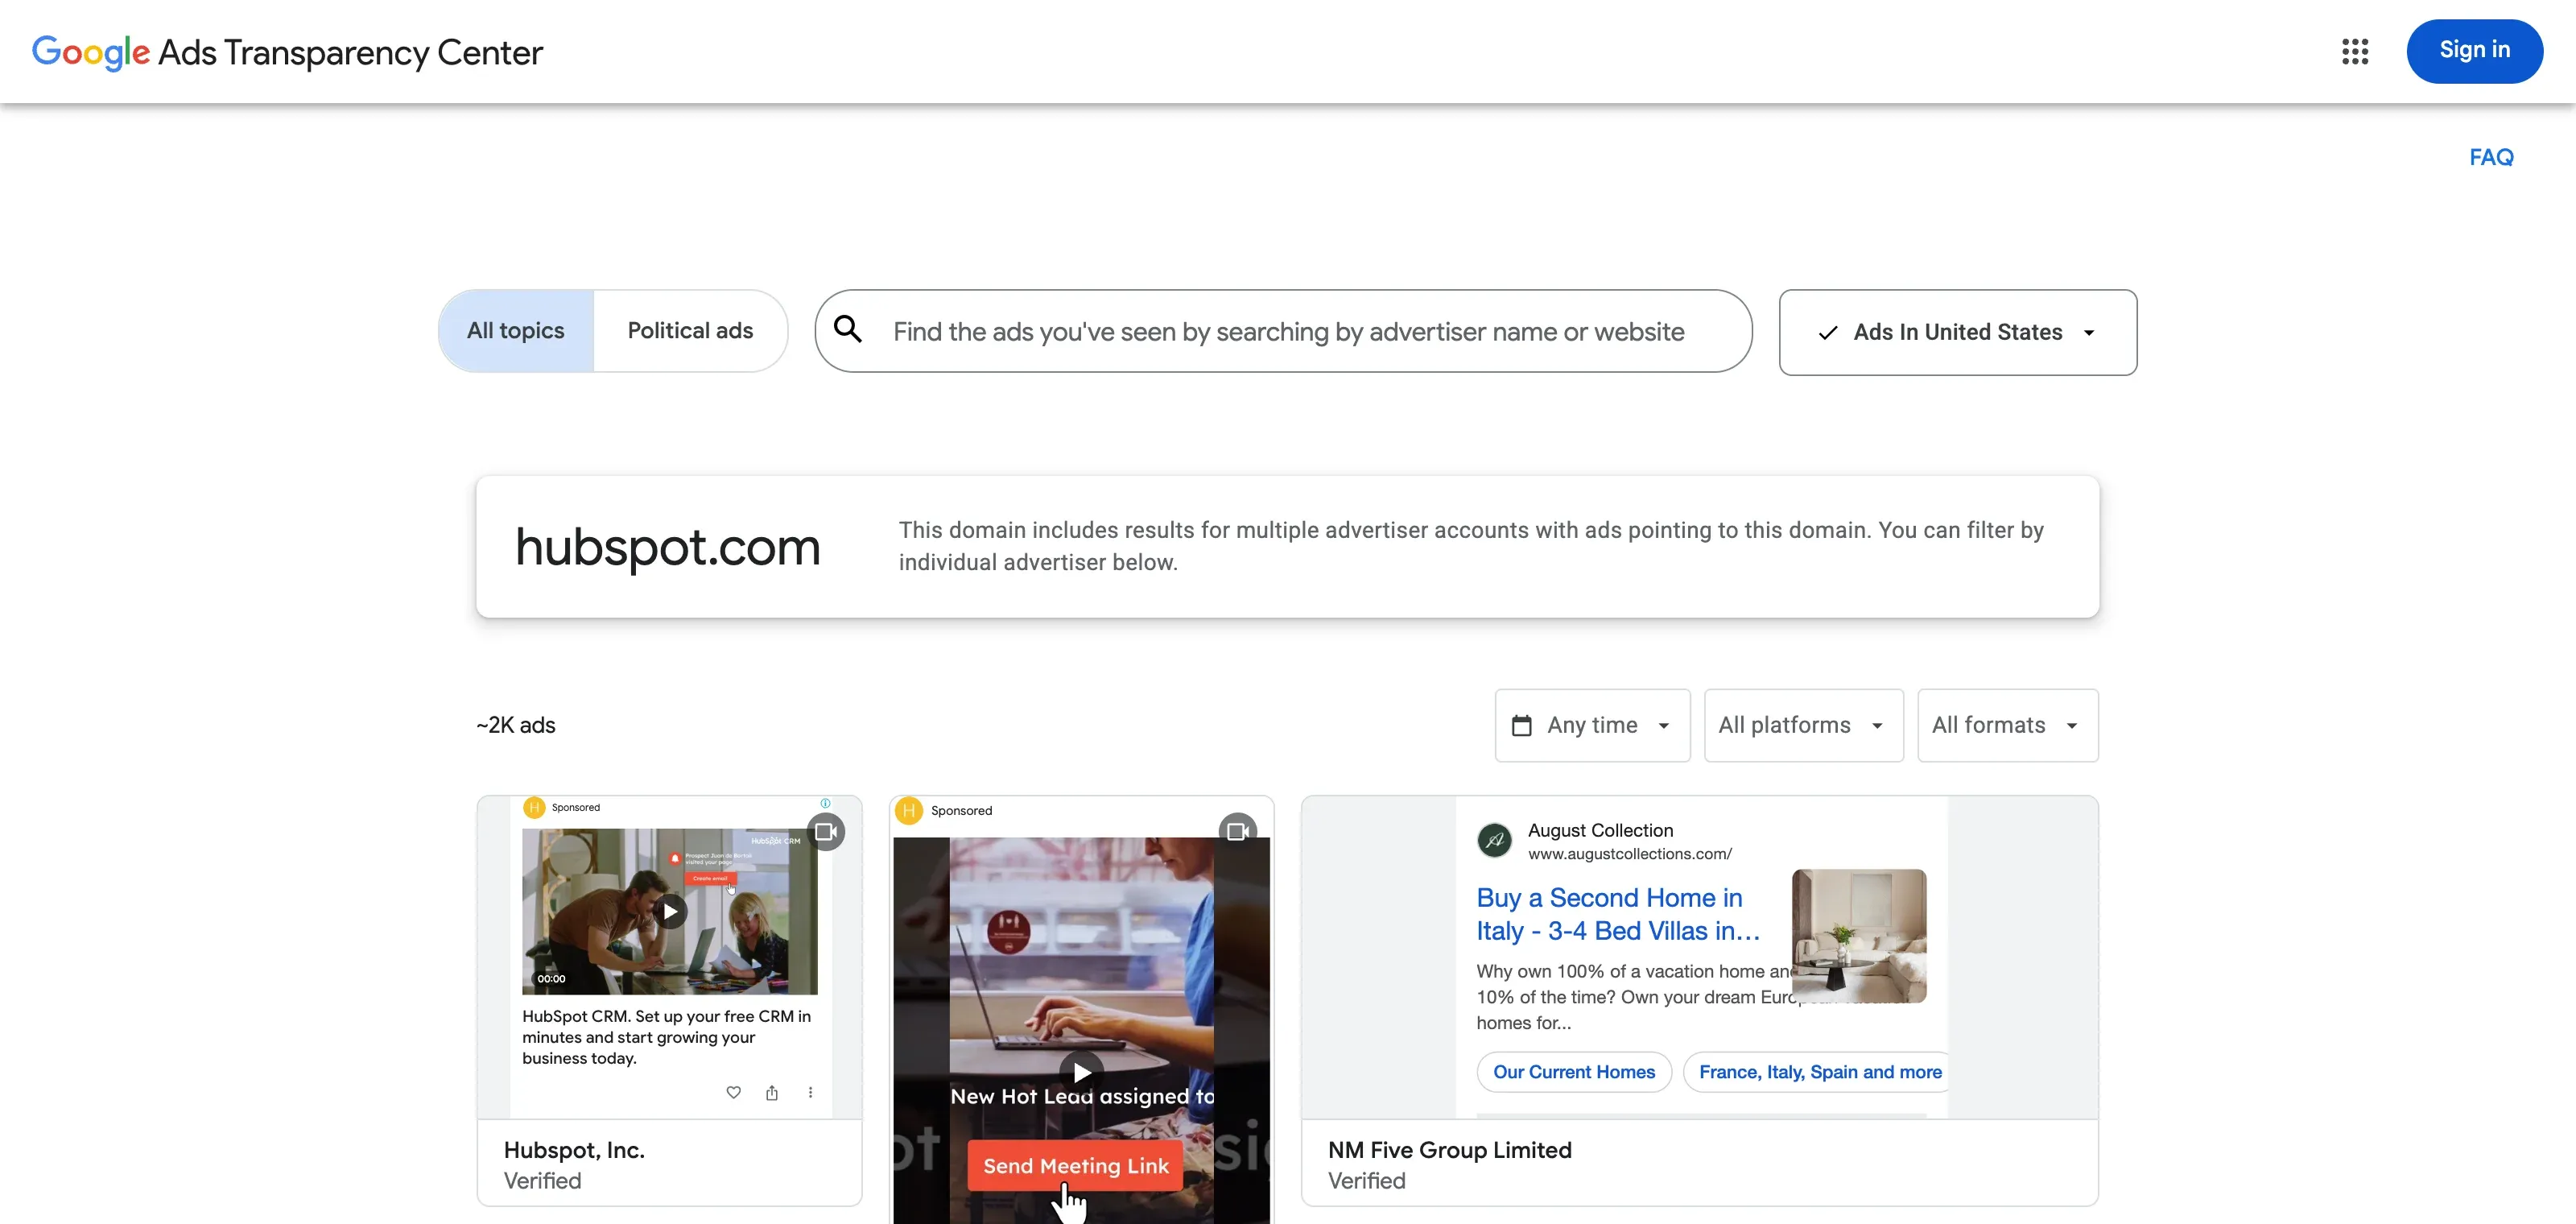 Google Ads Transparency Center shows ads served over a chosen period, with creative detail
Free tier: The whole tool. No account required.
Best for: PPC and brand marketers reviewing competitor Google Ads creative and recent activity.
What it does well:
- Searchable repository of ads served across Google properties in a chosen period
- Filter by geography and ad format
- Verified advertiser identity information
Limitations:
- Shows date ranges, locations served, and the last date an ad ran, but is not a complete long-term creative archive
- Spend data is limited outside political ads, and targeting and delivery detail varies by region (fuller for EU-served ads)
- Advertiser must be verified for some features to work
Pricing: Free.
Social Blade - Social platform benchmarking
Social Blade pulls public-facing metrics across YouTube, Instagram, TikTok, Twitch, and Facebook. Most platform stats are browsable without signing up; Instagram requires a free logged-in account. You get follower count, engagement rate, and growth curves. Social Blade does not cover X or LinkedIn. For professional-network tracking, a LinkedIn page monitor fills that gap.
Free tier: Social Blade's free logged-in plan. Most stats are browsable without an account, Instagram requires login, and the account saves 5 favorites per platform.
Best for: Influencer marketers, creator teams, and social media managers benchmarking competitor accounts.
What it does well:
- Historical follower and engagement trends across multiple platforms
- Public rank tables that aggregate category leaders
- Business API for data teams that want to pull signals (paid credits)
Limitations:
- Saved favorites cap at 5 per platform on the free account
- Does not cover X or LinkedIn
- Engagement estimates are based on public signals, not platform-verified data
Pricing: Free tier with 5 tracked accounts per platform. Paid tiers bill annually: Bronze works out to $5 per month, Silver $12.50, Gold $50.
Company research tools that catch funding, hires, and M&A signals
Owler - Company news and competitor alerts
Owler is a company-news aggregator with AI-summarized daily digests. The Community tier is thinner than it used to be. You can follow up to 5 companies, but the free allowance covers 1 full company profile view, 1 daily snapshot digest, and 1 real-time insight per month. Treat it as a product sample. Real usage starts at Pro.
Free tier: Follow 5 companies; 1 profile view, 1 snapshot digest, and 1 insight alert per month.
Best for: Sales, business development, and strategy teams that need a low-overhead feed of competitor and prospect news.
What it does well:
- Daily or weekly digest format that compresses reading time
- Community-sourced revenue and employee estimates for private companies
- News coverage of funding, leadership, and acquisitions
Limitations:
- Community tier allows 1 profile view and 1 digest per month, so daily tracking requires Pro
- Revenue estimates are directional only for private companies
- Deeper CI workflows require the Pro tier
Pricing: Community tier is free. Pro runs $39 per month billed annually ($468 per year). Max, the team and enterprise tier, is quote-based.
Crunchbase - Funding, M&A, and company data
Crunchbase is the reference database for startup and venture-backed company data. You get funding rounds, investors, founders, headcount trends, and acquisitions. For CI specifically, Pro expands search from 5 results to 1,000 and adds full list and alert workflows, so you can monitor entire categories of competitors at once.
Free tier: Company profiles, up to 5 results per search, activity alerts on one starter list, and limited AI and growth insights.
Best for: Strategy, corporate development, and venture teams tracking funding, acquisitions, and company formation in a market.
What it does well:
- Structured funding, investor, and company data
- Saved searches with alerts for new funding events or new company formations
- CRM Sync with Salesforce and HubSpot on the Business tier (Pro does not include it)
Limitations:
- Free search caps at 5 results per query; broader lists and workflows need Pro
- Private-company revenue estimates are not always accurate
- Crunchbase Pro is required for most CI workflows
Pricing: Free tier with basic profile views. Pro runs $79 per seat per month, billed annually. The $49 rate you will see at checkout is an introductory 38% discount that covers the first year only.
Google Alerts and Google Trends - Free web mentions and search demand
Google Alerts and Google Trends are the two free Google tools every CI stack includes. They are supplements, not primary sources. Alerts watches the indexed web for keywords. Trends shows relative search demand for a query or brand over time and by geography. Alerts does not watch specific pages. For that, teams tracking changes in terms and conditions or other page-level content need a different tool.
Free tier: Everything. Both tools are fully free with no paid tier.
Best for: Solo operators and small teams supplementing a paid CI stack with brand mention tracking and search-demand signal.
What it does well:
- Alerts are free for indexed web content, up to 1,000 alerts per account
- Trends shows brand popularity, seasonality, and category demand over time
- Trends geographic breakdowns and related queries are useful for market entry research
Limitations:
- Alerts miss a large share of non-indexed content and specific pages
- Alerts do not watch pages for changes. Only new indexed mentions.
- Trends data is relative, not absolute. It has coverage gaps for low-volume queries.
Pricing: Free.
Paid all-in-one competitive intelligence platforms for full workflows
These four platforms cover the full CI workflow in one product. That means collecting signals, analyzing them, distributing them, and enabling your team. It is also the most expensive category. Most require a sales call before pricing.
Klue - Competitive enablement built for product marketing
Klue is built to be the system of record for CI inside product marketing teams. It pulls competitor signals from across the web. It tags them against tracked companies. It surfaces what product marketers need for battlecards, win/loss analysis, and sales coaching. The moat is the integrations. Klue wires into Salesforce, Gong, Slack, and Highspot. Insights land in the tools sales teams already use, not in another tab.
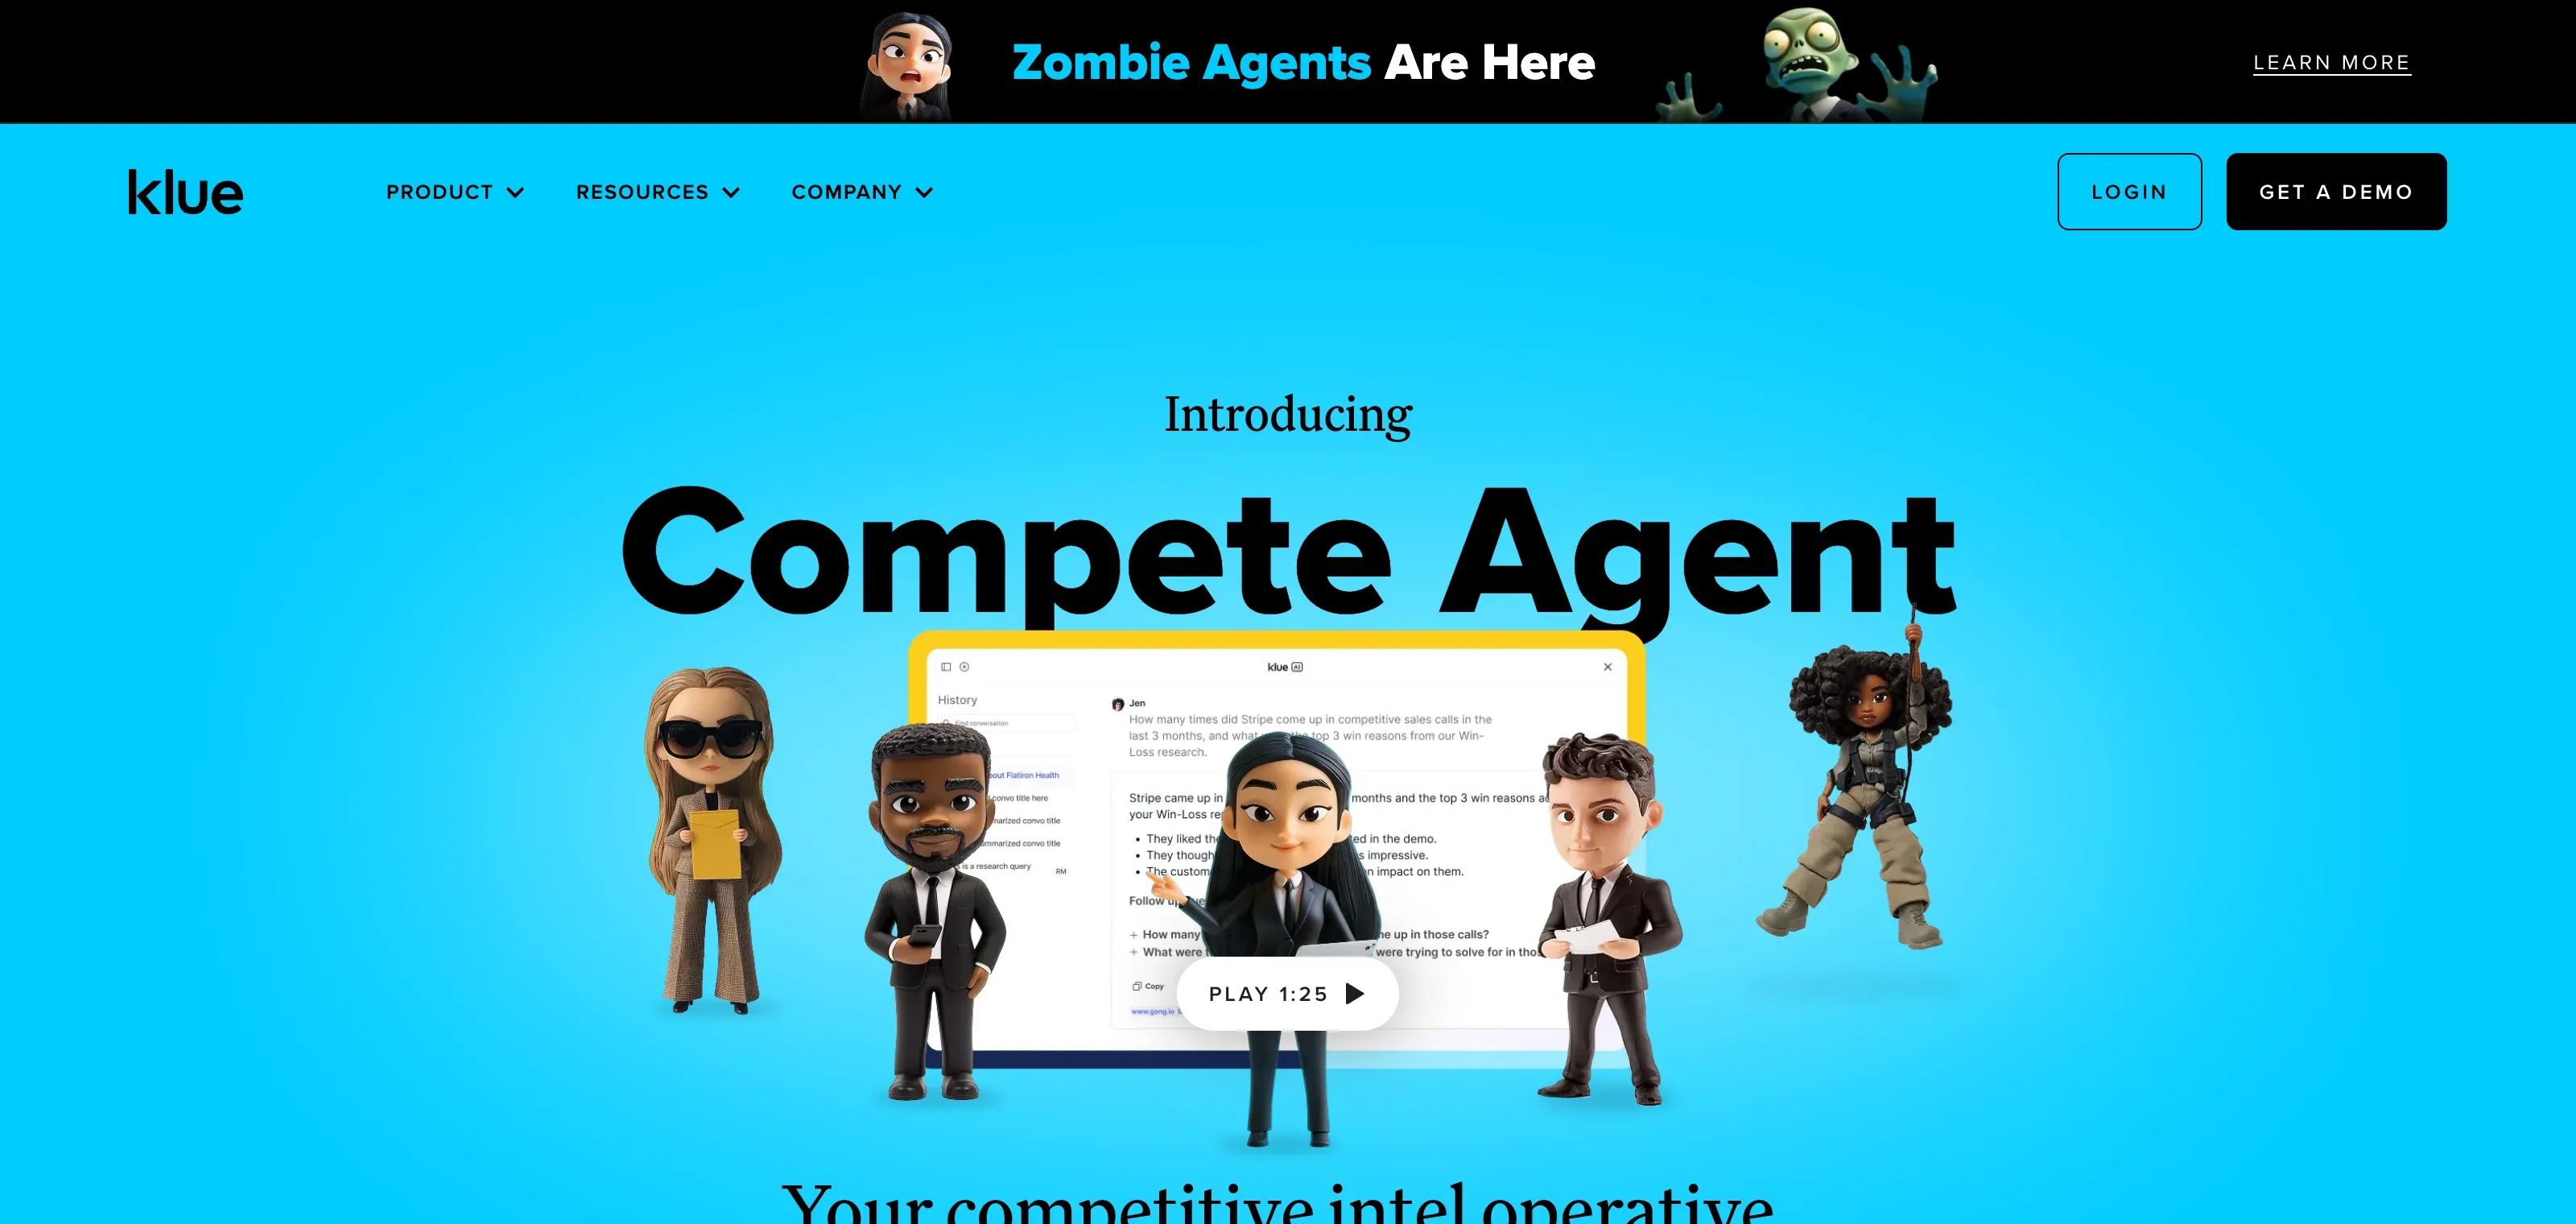 Klue's Compete Agent surfaces deal-based competitive insights for sales teams
Free tier: None. Quote-based sales process only.
Best for: Product marketing and enablement teams at B2B software companies. Best fit: named competitors, active sales teams.
What it does well:
- Auto-generates and version-controls battlecards with collaborator workflows
- Win/loss analysis with transcript ingestion and objection tagging
- Competitive landing page monitoring with AI-tagged diffs
Limitations:
- Pricing is not publicly listed. HubSpot listings suggest a $15,000 per year floor.
- Primarily English-language sources. Weaker for APAC or LATAM coverage.
- Needs real internal adoption to return value. Small teams without a dedicated CI function struggle.
Pricing: Quote-based. Industry references put Klue at $15,000 to $40,000 per year, depending on seats and tracked competitors.
Crayon - Competitive intelligence for fast-moving markets
Crayon is Klue's closest peer. Most RFPs evaluate both. Its pitch is breadth of signal. Crayon's platform tracks 100+ channels per competitor: web, social, reviews, hiring, and ad activity. Klue leans into battlecard workflows. Crayon leans into the underlying competitor tracking signal firehose.
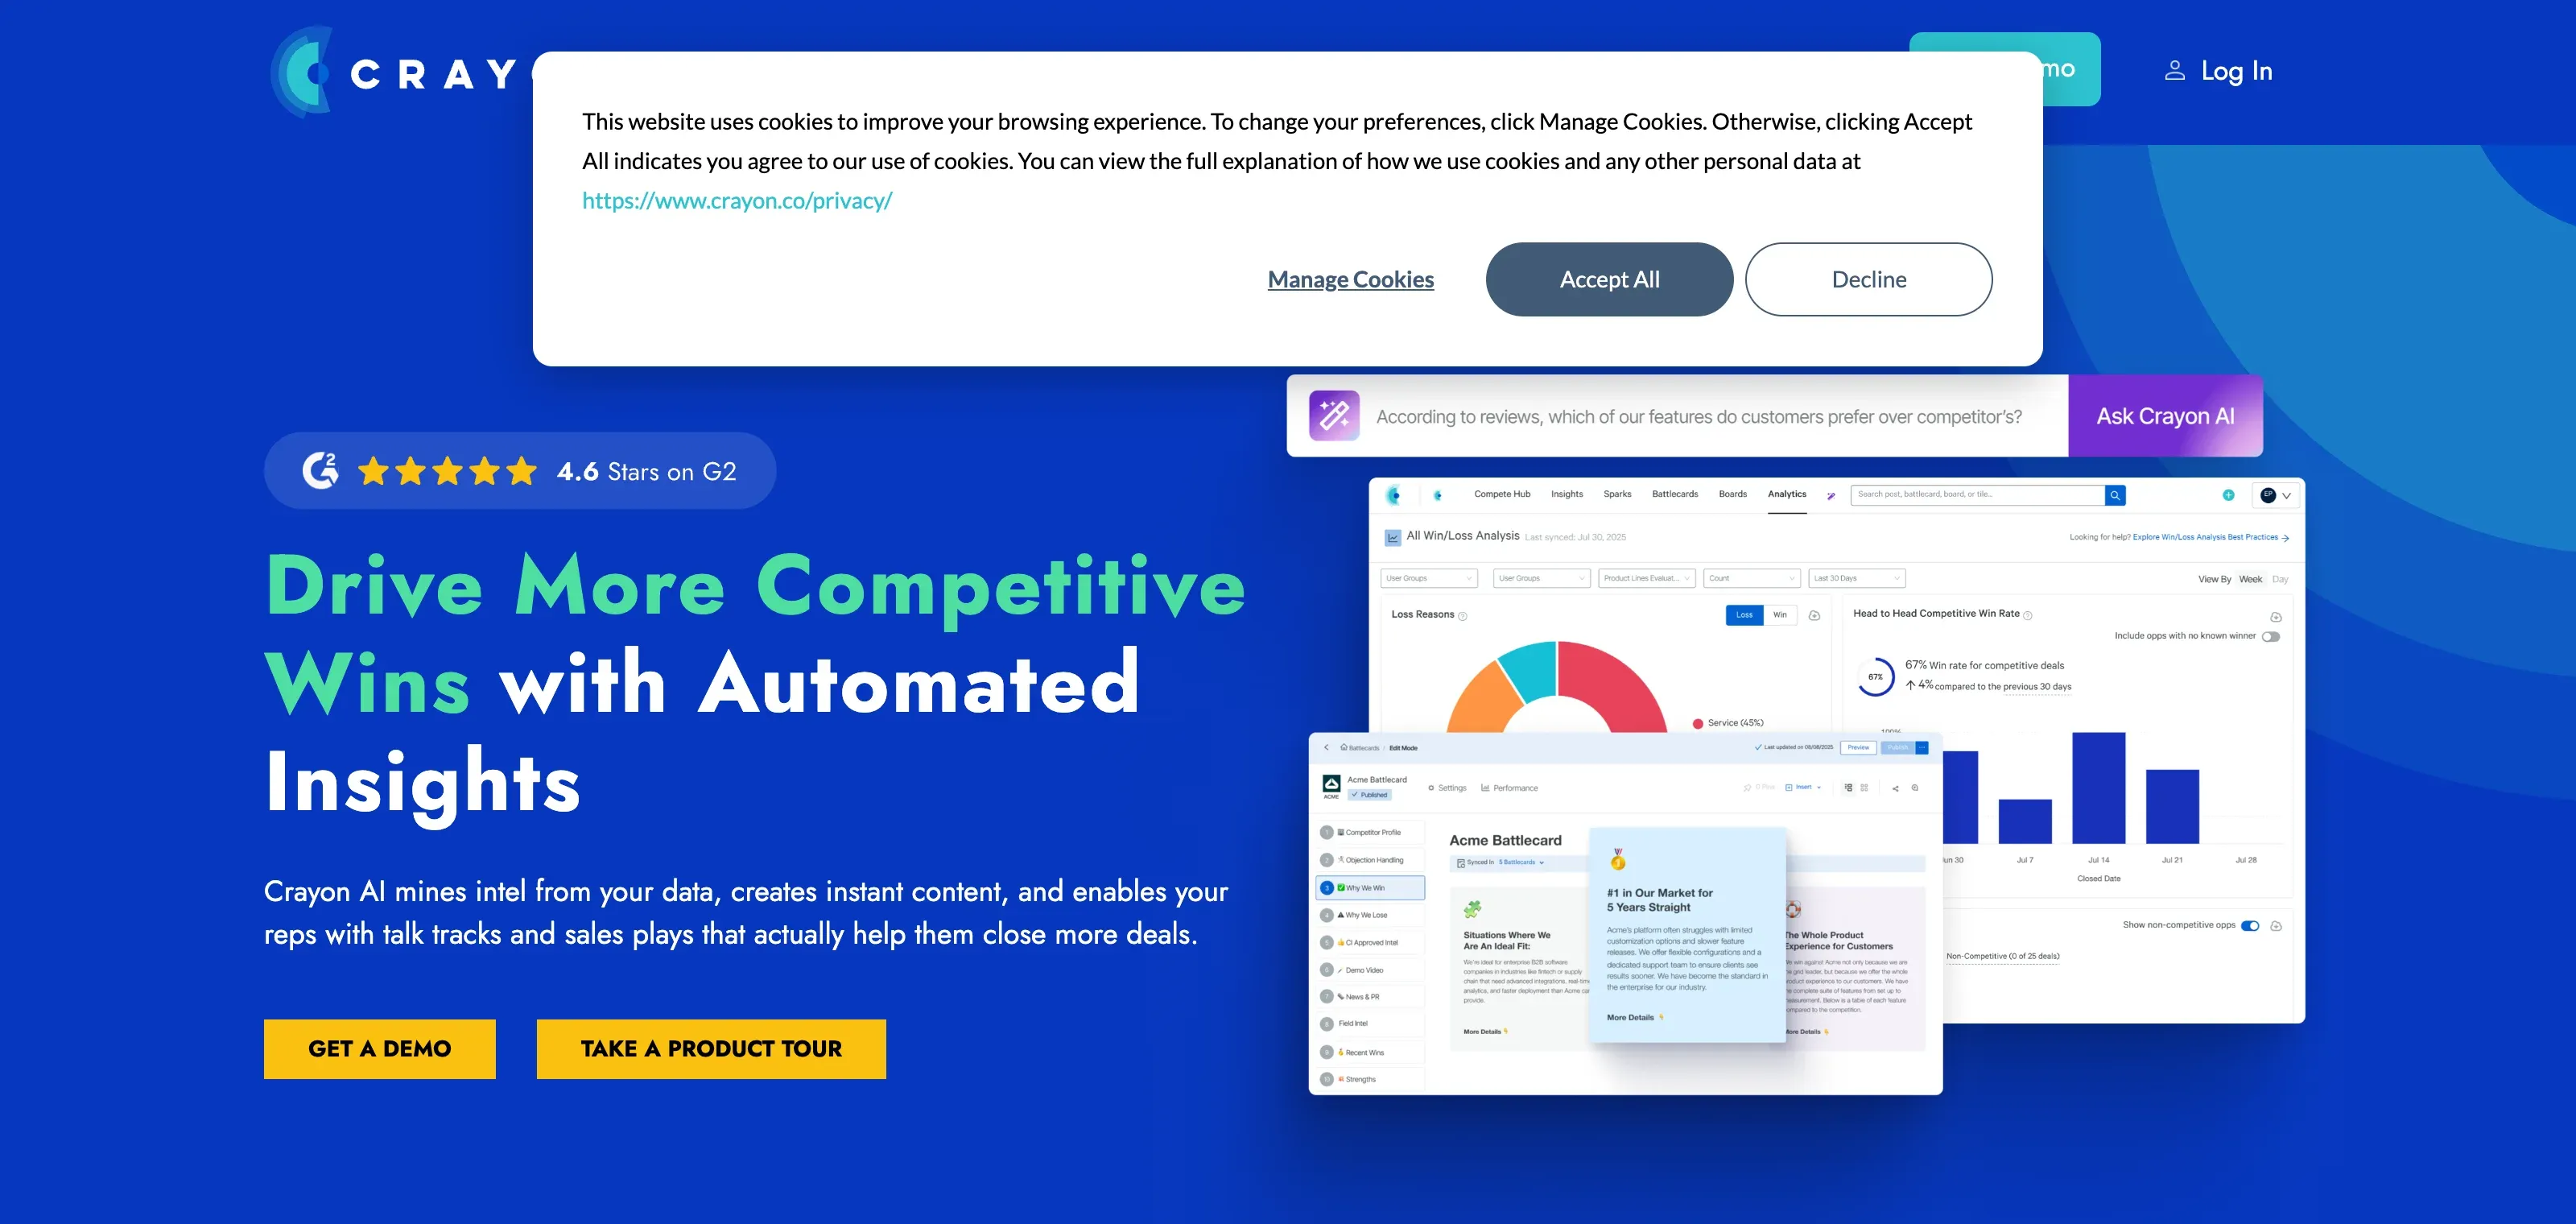 Crayon's breadth-of-signal pitch: 100+ channels per competitor profile
Free tier: None. No self-serve trial.
Best for: CI analysts who want broad signal coverage and control over tagging and summarization.
What it does well:
- Tracks 100+ signal sources per competitor profile
- AI summaries roll signals into weekly and monthly digests
- Flexible tagging model that fits custom CI frameworks
Limitations:
- Enterprise-priced. No free tier. No self-serve trial.
- Needs signal tuning for the first 30 to 60 days to avoid noise.
- Heavier setup time than Klue for teams without a dedicated CI analyst.
Pricing: Quote-based. Public benchmarks put Crayon in the $15,000 to $50,000 per year range.
AlphaSense - Market intelligence with financial and research depth
AlphaSense started in financial research. It has grown into general market and competitive intelligence. Its edge is the document corpus. You get broker research, earnings call transcripts, SEC filings, and premium news. All of it is searchable through an AI-assisted query interface. For teams where CI overlaps with regulatory intelligence, or with reading the room in public filings and analyst reports, AlphaSense fits best.
Free tier: None. Trials are arranged through sales.
Best for: Enterprise research, investment, and strategy teams pulling insight from SEC filings, broker notes, and premium news.
What it does well:
- 10,000+ integrated content sources, including proprietary research
- Smart Summaries and Generative Grid for synthesizing long documents
- Deep expert call library covering industry practitioners
Limitations:
- Priced for enterprise research budgets. Public benchmarks range from roughly $10,000 to $30,000+ per seat per year, depending on role and content access.
- Less useful for fast-moving product tracking like pricing pages or landing pages.
- Interface assumes research analyst familiarity. Longer ramp for marketers.
Pricing: Quote-based. Tiered by user role (research analyst vs. corporate) and content access.
Contify - Market and competitive intelligence platform
Contify sits between the enterprise giants and the self-serve category. It is a competitor and market intelligence platform. It has its own taxonomy engine and connects to the major CRMs. The advantage: you do not need a dedicated analyst team. Contify works for a mid-market CI function of one or two people.
Free tier: None. Demo and trial run through sales.
Best for: Mid-market and growth-stage companies with a lean CI function and named strategic competitors.
What it does well:
- Custom taxonomies that let you structure intelligence around your market
- CRM integrations that push insights into the sales workflow
- Newsletter and digest automation for internal distribution
Limitations:
- Smaller signal coverage than Klue or Crayon for SaaS-specific scenarios
- Interface is functional, not polished
- API depth is limited compared to enterprise alternatives
Pricing: Quote-based. Self-reported benchmarks put Contify at roughly $6,000 to $15,000 per year for mid-market teams.
Full comparison table
Use this table to narrow the list before testing two or three tools in depth. "Primary job" is the one job each tool is best at. If your need is outside the primary job, check the tool's section for fit.
| Tool | Primary job | Free tier | Paid starts at | Best for |
|---|---|---|---|---|
| Visualping | Website and page change monitoring | 5 pages, 150 checks/mo, AI summaries, API | $10/mo (annual) | Any team tracking URL-level changes |
| Semrush | SEO and PPC competitive | 10 reports/day | $117.33/mo (Pro, annual) | SEO and agency teams |
| Similarweb | Traffic benchmarking | 3-mo history, 5 results/report | $125/mo (annual) | Strategy and media teams |
| SpyFu | PPC history and keyword spy | Unlimited searches, truncated results | $29/mo (annual); ad history from $89/mo | PPC managers |
| Meta Ad Library | Facebook and Instagram ad spy | Unlimited | Free | Social ad marketers |
| Google Ads Transparency | Google ad spy | Unlimited | Free | PPC and brand teams |
| Social Blade | Social platform benchmarking | 5 saved favorites/platform | $5/mo (annual) | Influencer and social teams |
| Owler | Company news digests | 5 companies, 1 digest/mo | $39/mo (annual) | Sales and BD teams |
| Crunchbase | Funding and M&A data | Profiles + 5 results/search | $79/mo ($49 first year) | Strategy and corp dev |
| Google Alerts and Trends | Web mentions and search demand | 1,000 alerts/account; Trends unlimited | Free | Supplement to paid stack |
| Ahrefs | Backlinks and SEO depth | Own site only (Webmaster Tools) | $29/mo (Starter) | SEO teams focused on links |
| Klue | Battlecards and win/loss | None | ~$15,000/yr | Product marketing at B2B SaaS |
| Crayon | Multi-signal competitor tracking | None | ~$15,000/yr | Dedicated CI analysts |
| AlphaSense | Market research, filings, news | Trial via sales | ~$10,000-$30,000/yr per seat | Enterprise research teams |
| Contify | Mid-market CI platform | Trial via sales | ~$6,000/yr | Lean mid-market CI teams |
Free-tier limits and public entry prices in this table were re-verified against vendor pricing pages on July 21, 2026. Quote-based ranges (marked ~) are estimates from public benchmarks.
Publisher data: what 245,000 competitor monitors show
This section is Visualping's own platform data, separated from the tool reviews so the editorial comparison above stands on its own. Samples are anonymized, deduplicated, and limited to active monitors at the query dates.
The CI use case extends well past pricing. A broader Visualping sample queried in May 2026 shows the same monitoring infrastructure running on 245,000+ competitor-relevant pages across five distinct page types:
| Competitor page type | Active monitors in sample | Median check cadence | Detected a change in last 90 days |
|---|---|---|---|
| Product and feature pages | 156,823 | every 11.9 hours | 58% |
| News, blog, and press pages | 57,546 | every 8.8 hours | 47% |
| Careers and jobs pages | 17,103 | every 7.5 hours | 65% |
| Pricing and plans pages | 8,258 | every 4.6 hours | 59% |
| Changelog and release pages | 5,336 | every 4.8 hours | 73% |
Two takeaways. First, changelogs and release notes are the fastest-moving competitor surface in the sample. 73% of monitored changelog pages logged at least one change in 90 days. They are also the cleanest read on product-roadmap intent. Second, the same Visualping infrastructure runs across five distinct CI page types: pricing, careers, news, product, and changelog tracking. Sample is anonymized, deduplicated, and limited to currently active monitors as of May 2026.
Monitors with an IMPORTANT-flagged change, by page type
Volume is one thing. Signal density is another. Visualping classifies every detected change with a binary IMPORTANT flag from its AI summarizer, so users can route only the flagged changes to email, webhook, or (on Business plans) Slack.
Across the same May 2026 sample, among monitors that detected at least one change in 90 days, the share whose changes included at least one IMPORTANT flag splits sharply by page type:
| Competitor page type | Monitors with a change in 90d | Monitors with an IMPORTANT flag | Share |
|---|---|---|---|
| Product and feature pages | 90,494 | 56,327 | 62.2% |
| Careers and jobs pages | 11,097 | 4,729 | 42.6% |
| Changelog and release pages | 3,920 | 1,623 | 41.4% |
| News, blog, and press pages | 27,252 | 10,388 | 38.1% |
| Pricing and plans pages | 4,862 | 1,699 | 34.9% |
On pricing pages, about 35% of changed monitors had at least one change the AI judged IMPORTANT. Teams that route only flagged events point their attention at that minority. Two caveats for honest reading: these are monitor-level counts, not per-alert volumes, and the sample measures the classifier's output rather than validated ground truth.
Top-monitored competitor changelog pages on Visualping
Within the changelog category, monitoring concentrates on a small set of dev and platform vendors. Top by distinct VP users tracking the page (May 2026 sample, minimum 10 distinct users):
| Domain | Active monitors | Distinct users |
|---|---|---|
| github.com | 501 | 319 |
| learn.microsoft.com | 180 | 129 |
| discogs.com | 83 | 48 |
| developers.facebook.com | 75 | 41 |
| experienceleague.adobe.com | 52 | 32 |
| adobe.com | 31 | 30 |
| helpx.adobe.com | 72 | 28 |
| cloud.google.com | 37 | 28 |
| developers.google.com | 38 | 22 |
| docs.snowflake.com | 45 | 19 |
Pattern: developer-platform release notes (GitHub, Microsoft Learn, Google Cloud, Adobe Experience Cloud) dominate the changelog category. Product marketers, integration teams, and partner program leads use these monitors to catch API deprecations and new SDK features when they appear in the docs.
Cross-page-type CI coverage
In the same sample, 1,452 Visualping users run competitive monitors across 2 or more page types per competitor. 240 users run them across 3 or more. The most common multi-page pairing is product pages plus news/blog/press (563 users), followed by changelog plus news/blog (404 users). Both pairings show CI teams cross-referencing "what a competitor shipped" against "what a competitor said about it." Power users with 4 or 5 page types active across competitors (68 in the sample) treat Visualping as the data layer underneath an internal CI feed.
Free tier: 5 pages, 150 checks per month, checks as often as hourly, visual and text diffs, AI change summaries with the IMPORTANT flag, email and webhook alerts, and API access. No credit card.
SaaS pricing pages change faster than you think
Here are the most-watched SaaS pricing pages in a Visualping sample. HubSpot's pricing page changed on 96% of monitors in a 30-day window. Zoom: 100%. Datadog: 89%. DocuSign: 83%. Stripe: 80%. Twilio: 77%. Salesforce: 76%. These are the pages CI and product marketing teams track most often. And they are the ones that move most often.
| SaaS pricing page | Active monitors in sample | 30-day change rate |
|---|---|---|
| Zoom | 18 | 100% |
| HubSpot | 88 | 96% |
| Constant Contact | 23 | 96% |
| Datadog | 61 | 89% |
| DocuSign | 29 | 83% |
| Stripe | 20 | 80% |
| Twilio | 44 | 77% |
| Salesforce | 59 | 76% |
| Klaviyo | 30 | 73% |
| Monday.com | 29 | 69% |
The takeaway: if you sell into MarTech, CRM, observability, or developer tools, your competitors update pricing on a faster clock than a quarterly review, which learns late and misses updates that revert in between. Your monitoring cadence should match the content cadence. For a deeper frame, see our guide to competitive pricing analysis.
The pattern holds at the per-check level. Across a 30-day sample of Visualping checks on AI-tagged pricing pages, 16.3% of checks fired a change alert. News-tagged pages: 11%. Investor relations: 7%. Different content types, different signal density.
How to choose a CI stack by team size and use case
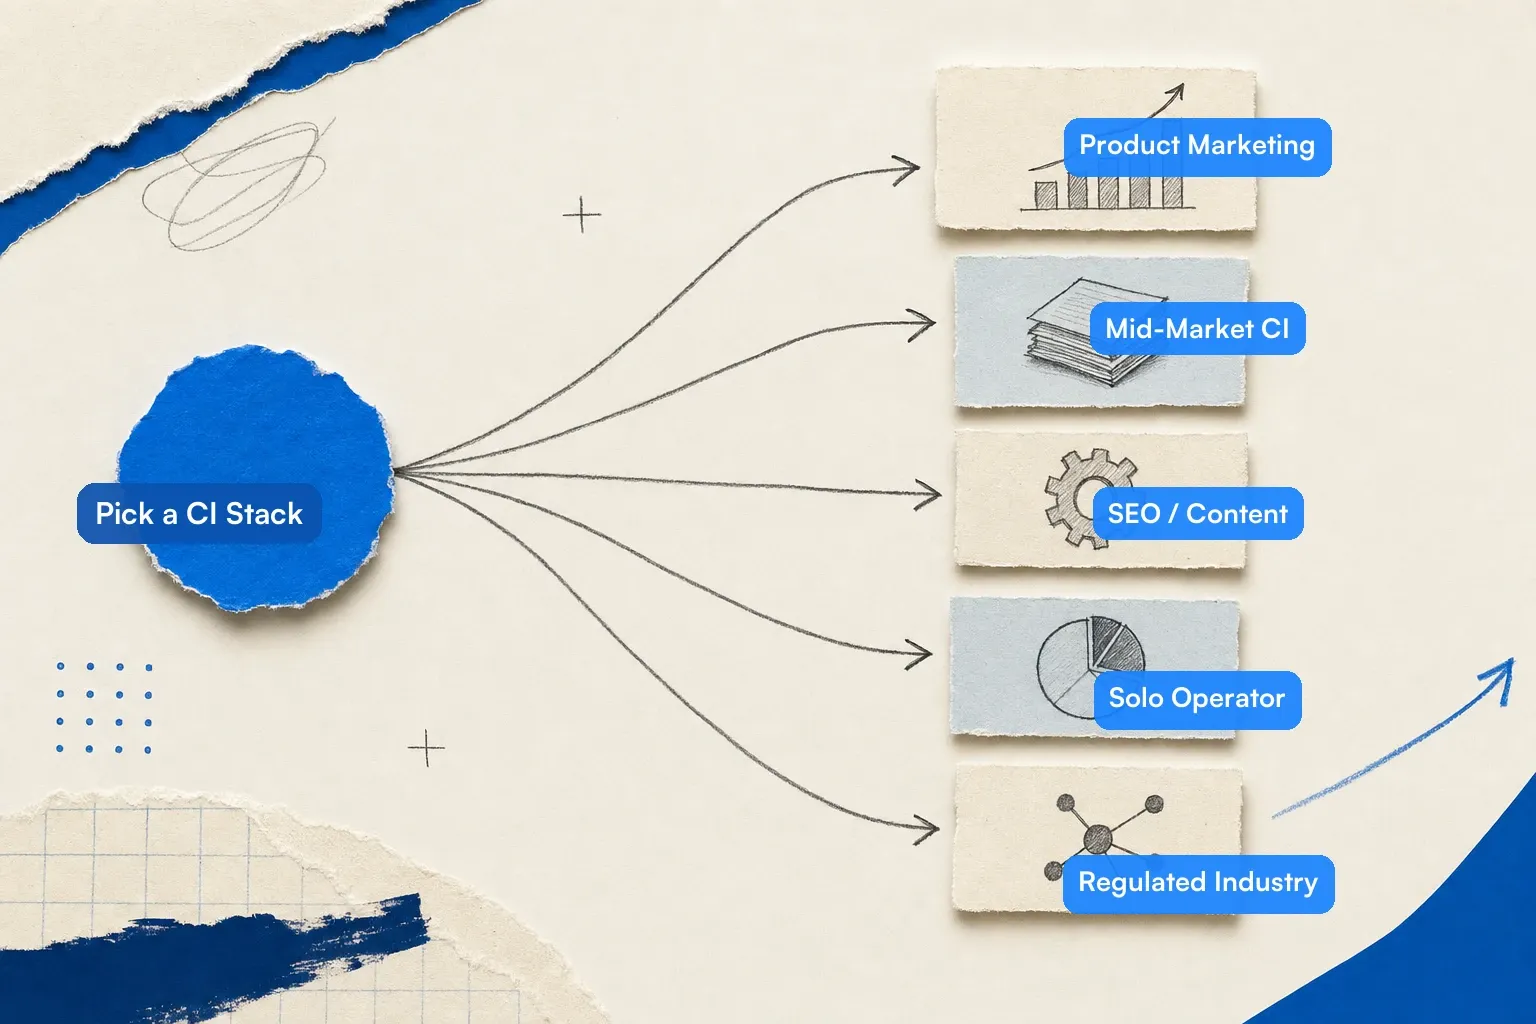 The right CI stack depends on team size and what you need to track
Positioning expert April Dunford makes the point that features only count as differentiated when they are compared against competitive alternatives. The tools in this guide make that comparison continuous instead of quarterly. The right stack depends on what you need to know and who is using it.
The short version:
| Team | Core stack | Estimated annual budget |
|---|---|---|
| Product marketing with an active sales team | Klue or Crayon + Visualping Business + free ad libraries | ~$16,000-$51,000 (quotes) |
| Lean mid-market CI team of 1-2 | Contify + Visualping + Semrush | ~$8,000-$17,000 |
| SEO or content team | Semrush or Ahrefs + Visualping | ~$1,500-$5,500 |
| Solo operator or early stage | The free stack in this guide | $0 |
| Research-heavy or regulated (enterprise) | AlphaSense + Visualping Solutions | ~$13,000-$33,000+ (quotes) |
| Research-heavy or regulated (mid-market) | Contify + Visualping Solutions | ~$9,000-$18,000 (quotes) |
If you are a product marketing team with named competitors and an active sales team, Klue or Crayon sit at the center of your stack. Pair either one with Visualping for page-level change tracking. Add Meta Ad Library and Google Ads Transparency for social and search ad visibility. Budget: roughly $15,000 to $50,000 a year for the all-in-one (quote-based estimates), plus $1,200 to $2,000 a year for the supplements once a Visualping Business plan carries the native Slack alerts. The Visualping setup that pays off first for product marketing is competitor pricing-page and ad-library monitoring, with alerts routed to Slack on the Business plan (from $100 per month billed annually).
If you are a lean mid-market CI team of one or two people, Contify plus Visualping plus Semrush is the stack. It covers pricing, page changes, and SEO competitive. Total annual budget lands roughly between $8,000 and $17,000, driven mostly by the Contify quote. The Visualping piece starts at $10 per month on the annual plan for 10 pages; tracking four page types across five competitors takes the 20-page tier at $25. The free tier (150 checks per month) is the cheap way to test fit before upgrading.
If you are an SEO or content team running CI as one of many jobs, Semrush or Ahrefs plus Visualping is the default. Visualping pushes alerts on the exact URLs you choose, on your cadence. Semrush or Ahrefs handles keywords and backlinks. For teams leaning into AI-native tools specifically, see our 10 best AI tools for competitor analysis. For SEO teams specifically, Visualping watches landing-page copy and pricing-page changes on a schedule you set. A free Visualping monitor rides on top of the Semrush or Ahrefs stack.
If you are a solo operator or early-stage team, the free tools go further than most people expect. Visualping Free, Google Alerts, Meta Ad Library, Google Ads Transparency, Crunchbase free, and SpyFu's free version together cover a lot. Pricing changes. Brand mentions. Social and search ads. Funding events. Keyword overlap. For more ways to compare competitor websites on a zero-dollar budget, the free stack reaches further than teams assume. The cost is time, not money. You will spend more time in each tool. The signal is less consolidated than in a paid CI platform. For solo operators on a zero-dollar budget, Visualping's free plan covers 5 competitor pages on a daily cadence. That is a $0 start to a real CI program.
If you are in a research-heavy or regulated industry like finance, healthcare, or legal, AlphaSense sits at the center of an enterprise stack for filings, broker research, and premium content; Contify covers continuous market monitoring at mid-market budgets. Pair either with Visualping's regulatory intelligence monitoring for page-level rule and policy changes. The Visualping piece starts free; the Solutions tier handles managed compliance monitoring at scale.
Ready to set up website change monitoring on your first five competitor pages? Visualping's free plan runs 150 checks per month. That is five competitor pages on a daily cadence. Paste the URLs, enter your email, and the monitors start running right away.
Frequently asked questions
What are the best free competitive intelligence tools?
The best free competitive intelligence tools, by job: Meta Ad Library and Google Ads Transparency Center for competitor ad creative, both fully free with no account. Visualping's free plan for page-change monitoring, with 5 pages, 150 checks a month, and an AI summary plus importance flag on every alert. Semrush's free account for keyword and domain lookups at 10 reports a day. Similarweb's free tier for traffic benchmarking across 3 months of history. Google Alerts for brand-mention tracking (up to 1,000 alerts per account). Owler Community and Crunchbase's free profiles for funding and leadership news. Together they cover ads, page changes, SEO, traffic, mentions, and company news for $0. Limits verified July 21, 2026.
Is there a completely free competitive intelligence tool?
Three entries in this guide are completely free, with no paid tier required for the core job: Meta Ad Library, Google Ads Transparency Center, and the Google Alerts + Google Trends pair, which share one entry. The freemium group (Visualping, Semrush, Similarweb, SpyFu, Owler, Crunchbase, Social Blade) gives you a working slice free and charges for scale. The no-free group (Klue, Crayon, AlphaSense, Contify, Ahrefs) starts at $29 a month for Ahrefs Starter and climbs to enterprise platforms around $6,000 to $30,000 or more a year (quote-based estimates).
Which free competitive analysis tools should I use?
Free competitive analysis tools split by signal type. Use Meta Ad Library and Google Ads Transparency Center for competitor ads, Visualping Free for page changes on pricing and product pages, Semrush Free for keyword and backlink spot checks, Similarweb Free for traffic direction, Google Alerts for mentions, and Owler Community or Crunchbase free for company news. Start with the two or three signals your decisions depend on, then add a tool when a signal earns a permanent place in your week.
What is the best tool for competitor analysis?
Best for what? Pick by job, not by brand. For product marketing battlecards and win/loss: Klue and Crayon. For SEO competitive analysis: Semrush and Ahrefs. For PPC and competitor ad creative: SpyFu plus Meta Ad Library and Google Ads Transparency. For website and page change monitoring on competitor pricing, careers, changelog, blog, and ad-library pages: Visualping (the same infrastructure tracks 245,000+ competitor-relevant pages in our internal sample). For market research using filings and broker notes: AlphaSense. For continuous market monitoring at mid-market budgets: Contify. For lightweight company-news digests: Owler and Crunchbase. Most CI teams use three to five tools, not one. The comparison table above is the fastest way to map your specific jobs to tools.
What is the difference between competitive intelligence and market intelligence?
Competitive intelligence focuses on specific competitor companies. Their products. Their pricing. Their positioning. Their moves. Market intelligence is broader. It covers the industry as a whole, category demand trends, regulatory shifts, and customer behavior in aggregate. CI tools like Klue, Crayon, and Contify lean competitive. Market intelligence tools like AlphaSense and Similarweb lean market. Most teams need some of both. The ratio depends on how crowded and dynamic the category is.
Do I need a paid tool, or are free ones enough?
Most CI stacks are smaller than tool vendors assume. Andy McCotter-Bicknell, Lead Product Marketing Manager, AI, MCP, Automations at Apollo.io, puts it this way in his Maven course on building CI programs: "Most competitive intel 'teams' are teams of one."
Our data agrees. In a sample of 13,859 Visualping users who set up at least one competitor monitor: 59% run a single monitor. 29% run two to four. Only 2% run ten or more. If your stack fits those bands, a free combination usually covers the job. That stack: Visualping Free, Meta Ad Library, Google Ads Transparency, Google Alerts, Crunchbase free, SpyFu's free version. Paid tools earn their place once manual signal stitching costs more time than a license costs money.
Can ChatGPT do a competitor analysis?
A general-purpose AI chatbot can draft a competitive analysis from public information it has indexed, including positioning summaries, feature comparisons, and SWOT-style frames. Some chatbots now run scheduled tasks that re-visit a page and summarize what changed, and the limits show up fast in production: hourly checks at best, small caps on active tasks, no exact visual or text diffs, no change history, no webhook delivery, and tasks that can pause without telling you. A real CI workflow combines AI summarization (to compress signal) with a dedicated change-monitoring tool (to catch the signal in the first place). Visualping's AI change summarizer pairs the two: every detected change on a monitored URL ships with a binary "important / not important" flag and a plain-language summary, so the AI is reasoning over fresh page-level data instead of stale training-set knowledge.
How does AI change competitive intelligence in 2026?
AI is squeezing the time between collection and insight. Among teams already using AI for competitive intelligence, 60% use it daily, per Crayon's 2025 State of Competitive Intelligence research. Separately, the same research series found teams that share competitive intel with sales daily report an 84% lift in competitive sales effectiveness. Both figures come from vendor-sponsored surveys. Tools like Klue, Crayon, and AlphaSense auto-summarize competitor signals. They cluster them by theme. They surface anomalies without a human analyst tagging every event. Visualping's AI change summarizer is an example at the monitoring layer. Every page change gets an importance flag and a plain-language summary. The collection layer is mostly automated. The judgment layer (what matters, what is noise, what to do about it) is still human.
About this guide
This guide is produced by the Visualping content team. We draw on public commentary from competitive intelligence practitioners including April Dunford and Andy McCotter-Bicknell. We also use category research: Crayon's 2025 State of Competitive Intelligence benchmark and the Forrester Wave: Market and Competitive Intelligence Platforms, Q4 2024. Tool pricing and free-tier limits were re-verified against each vendor's public pricing page on July 21, 2026, or against public benchmarks where a vendor does not publish pricing.
The Visualping data points in this guide are drawn from our internal analytics platform, queried on 2026-04-23 and refreshed on 2026-05-05. They include:
- The 9,705 active pricing-page monitors and 2.8-hour median check cadence
- The 42% 30-day change rate on pricing-page monitors
- The top-10 SaaS pricing-page change-rate table
- The 19,499-monitor sample owned by users who self-declared competitor tracking at signup (a different cohort from the 13,859 users with at least one competitor monitor cited in the FAQ, who are defined by behavior rather than declaration)
- The 1.78M active-monitor population
- The May 2026 page-type breakdown: 156,823 product/feature monitors, 57,546 news/blog monitors, 17,103 careers monitors, 8,258 pricing monitors, 5,336 changelog monitors, with their respective median check cadences and 90-day change-detection rates
- The ownership and content-type splits
- The 1-to-4 monitor distribution among CI-declared users
All figures are framed as samples, not platform totals. They reflect aggregate behavior across anonymized active accounts at the query date.
If you want the method behind these tools, see how to monitor competitor sites for the signals that matter. If you want to start watching competitor pricing, careers, changelog, and ad-library pages change before your quarterly review catches them, paste 5 URLs into Visualping's free plan. Setup takes about 90 seconds. No credit card. 150 checks per month. API access on every tier.
Visualping: competitor monitoring made simple
Get targeted updates from the competition on autopilot. Trusted by 85% of Fortune 500 companies.
Eric Do Couto
Eric Do Couto is the Head of Marketing at Visualping. He leads content strategy, growth operations, and brand positioning for website change detection.
More articles by Eric Do Couto