Visualping Reports Guide: Create, Schedule, and Share
By The Visualping Team
Updated March 6, 2026

TL;DR: Select which monitoring jobs to include, pick a date range, toggle on AI summaries, and hit Generate. Your first Visualping Reports briefing takes under 2 minutes. Set a recurring schedule to get it delivered daily or weekly to everyone in your workspace. Export as PDF, Excel, CSV, or share via link. Free with all Business plans.
If you're monitoring websites with Visualping, you already get alerts when things change. But what if you want the big picture: a single, consolidated summary of every change across all your monitoring jobs? That's exactly what Visualping Reports does. It pulls together changes from your entire workspace into one view, complete with AI-generated analysis, visual diffs, and export options so you can share findings with your team.
This Visualping Reports guide walks you through creating, scheduling, and sharing your first briefing. (For the full feature overview, read our Reports announcement post.)
Before you start
What you need: A Visualping Business plan with at least one active monitoring job. Reports aggregates changes from your existing monitors, so the more jobs you have running, the richer your first report will be.
Time to complete: About 2 minutes for your first report. One extra minute if you want to set up a recurring schedule.
Important: Before generating a report, you select which monitoring jobs to include using the checkboxes in your job list. You can include all jobs in a workspace or cherry-pick specific ones. If you want totally separate recurring briefings for different purposes (competitive tracking vs. compliance, for example), organizing jobs into separate workspaces is the cleanest setup, but per-job selection gives you flexibility within a single workspace too.
Step 1: Generate your first report
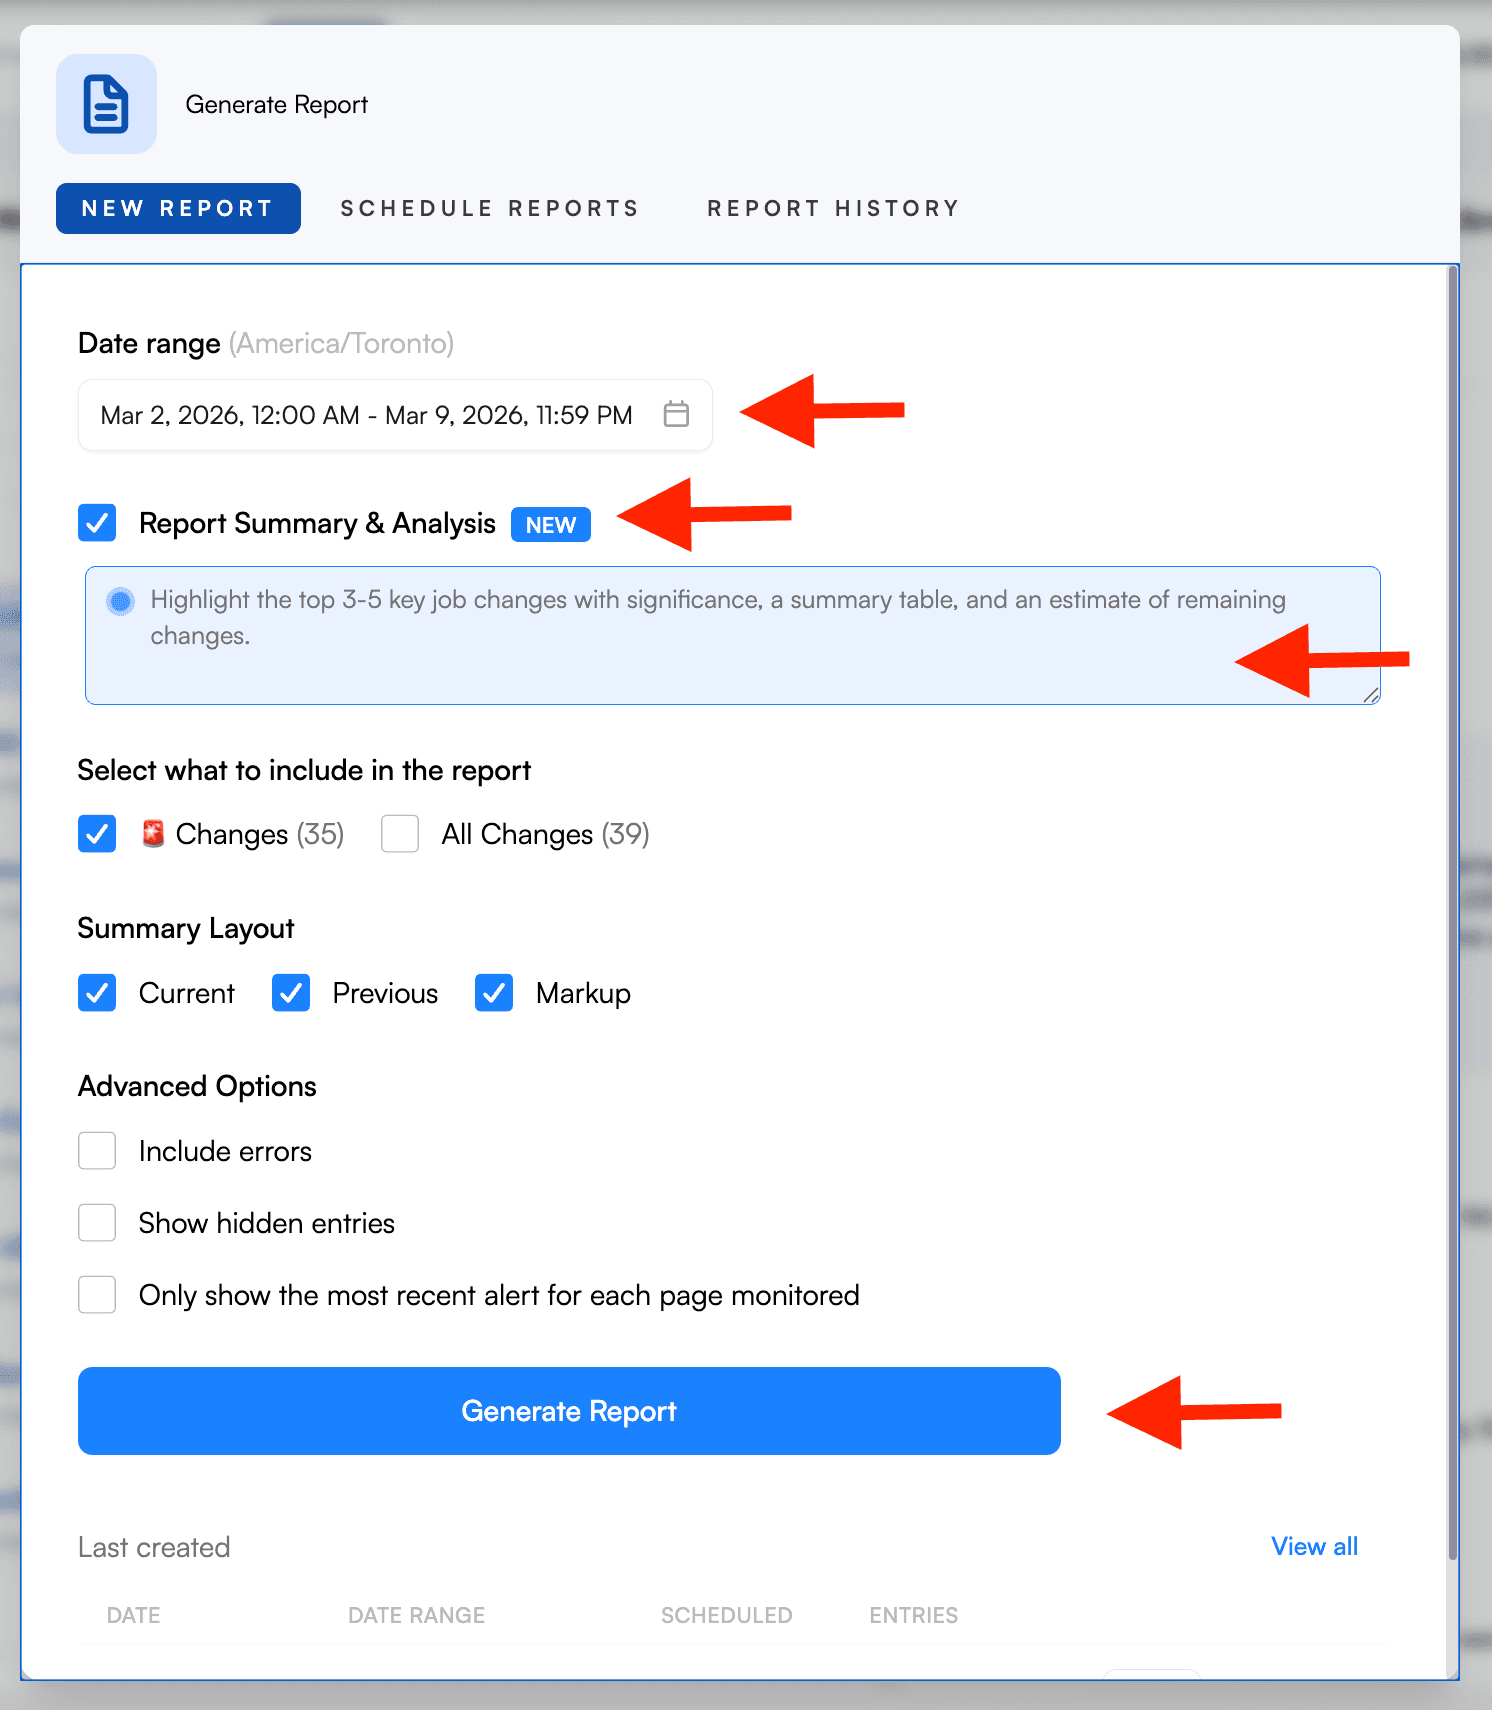
Navigate to the Reports tab in your workspace. You'll land on the Visualping Reports New Report screen, where you'll configure what goes into your report.
Select your monitoring jobs
In your job list, use the checkboxes to select which monitoring jobs you want included in this report. You can select all jobs in the workspace or pick specific ones. This is how you scope a report to just your top competitors, a specific client, or a particular set of pages.
Set your date range
At the top, you'll see two date pickers: a start date and an end date. The end date defaults to Now, so you just need to set how far back you want to look. Building your first report? Try the last seven days to get a meaningful sample without overwhelming yourself.
Choose what to include
Under "Select what to include in the report," you have two options:
- Important Changes. This is selected by default, and it's the right choice for your first report. It filters down to the changes Visualping has flagged as significant, cutting out the noise.
- All Changes. Includes everything detected during your date range. Better suited for thorough audits where you don't want to miss a thing.
For your first report, stick with Important Changes. You'll get a cleaner, more actionable summary.
Turn on Report Summary & Analysis
Toggle on "Report Summary & Analysis" to get an AI-generated summary at the top of your report. This is the section that reads across all your selected changes and identifies patterns: pricing shifts across competitors, messaging changes, new content themes. It's the same AI engine that powers Visualping's intelligent change detection, applied to cross-job pattern recognition. Without this toggle, you still get the individual change entries and visual diffs, but no synthesized overview. Turn it on.
Configure the summary layout
The Summary Layout section controls what visual information appears for each change entry. All three options are selected by default:
- Current. Shows a screenshot of the page as it looks now (after the change).
- Previous. Shows a screenshot of the page before the change happened.
- Markup. Shows a highlighted diff view that visually calls out exactly what changed between the two versions.
Leave all three checked. The side-by-side comparison of Current and Previous gives you context, while Markup lets you instantly spot the differences without hunting for them.
Advanced options
Expand Advanced Options to find two additional settings:
- Include errors. Off by default. Turn this on if you want to see monitoring jobs that encountered errors (like pages that failed to load) during your date range.
- Only show the most recent alert for each page monitored. Also off by default for one-time reports. This collapses multiple changes on the same page down to just the latest one. Useful when a page changed several times and you only care about where it ended up.
Generate it
Click the blue Generate Report button. Visualping will compile your report, and it will appear in the Last created section at the bottom of the page. From there, you can open it in the dashboard, or export as PDF, Excel, or CSV. You can also share via link, email, or print (or delete it if you no longer need it).
That's it for your first report. Now let's make it automatic.
Ready to generate your first Visualping Reports briefing? Open Reports in your workspace → Setup takes under two minutes.
Step 2: Set up a recurring schedule
Switch to the Schedule Reports tab. This is where Visualping Reports becomes fully automatic: you tell it when to generate and deliver briefings, and it runs on that cadence without you lifting a finger.
Configure the schedule
The "Run on" section lets you set three things:
- Cadence. A dropdown that lets you choose how often the report runs. Daily is the most common starting point, and other cadences may be available depending on your needs.
- Time. Pick when the report generates. A time like 09:00 AM means it'll be waiting in your inbox when you start your day.
- Timezone. Displayed next to the time picker (for example, "Timezone: America/Toronto"). This ensures the report generates at the right local time for your team.
Review the report settings
The scheduled report uses the same configuration options as a one-time report: what to include, summary layout, and advanced options. One notable difference: "Only show the most recent alert for each page monitored" is checked by default for scheduled reports. This is a smart default for daily digests because it prevents the same page from showing up multiple times if it changed more than once since your last report.
Know who gets it
An important detail: scheduled reports are delivered to all users in the workspace. You don't pick individual recipients. If you need different people to get different reports, organize your monitoring jobs into separate workspaces.
Once your schedule is active, you'll see a countdown (something like "Next report generation: in 22 hours") and a red Cancel reporting button if you ever need to turn it off.
Step 3: Read and act on your report
When your Visualping Reports briefing is ready (whether you generated it manually or it arrived on schedule), open it in the Web (Reports) format for the richest experience.
Start with the AI summary
At the very top of the report, you'll find an AI Summary section. Visualping's AI analyzes patterns across all the changes in your report and synthesizes them into a narrative. For example, if you're monitoring competitor ad libraries as part of your competitive intelligence workflow, the AI might identify trends in ad creative velocity, highlight shifts in social proof metrics, or flag test-and-iterate patterns it detected across multiple pages.
Read this section first. It gives you the strategic overview before you explore individual changes.
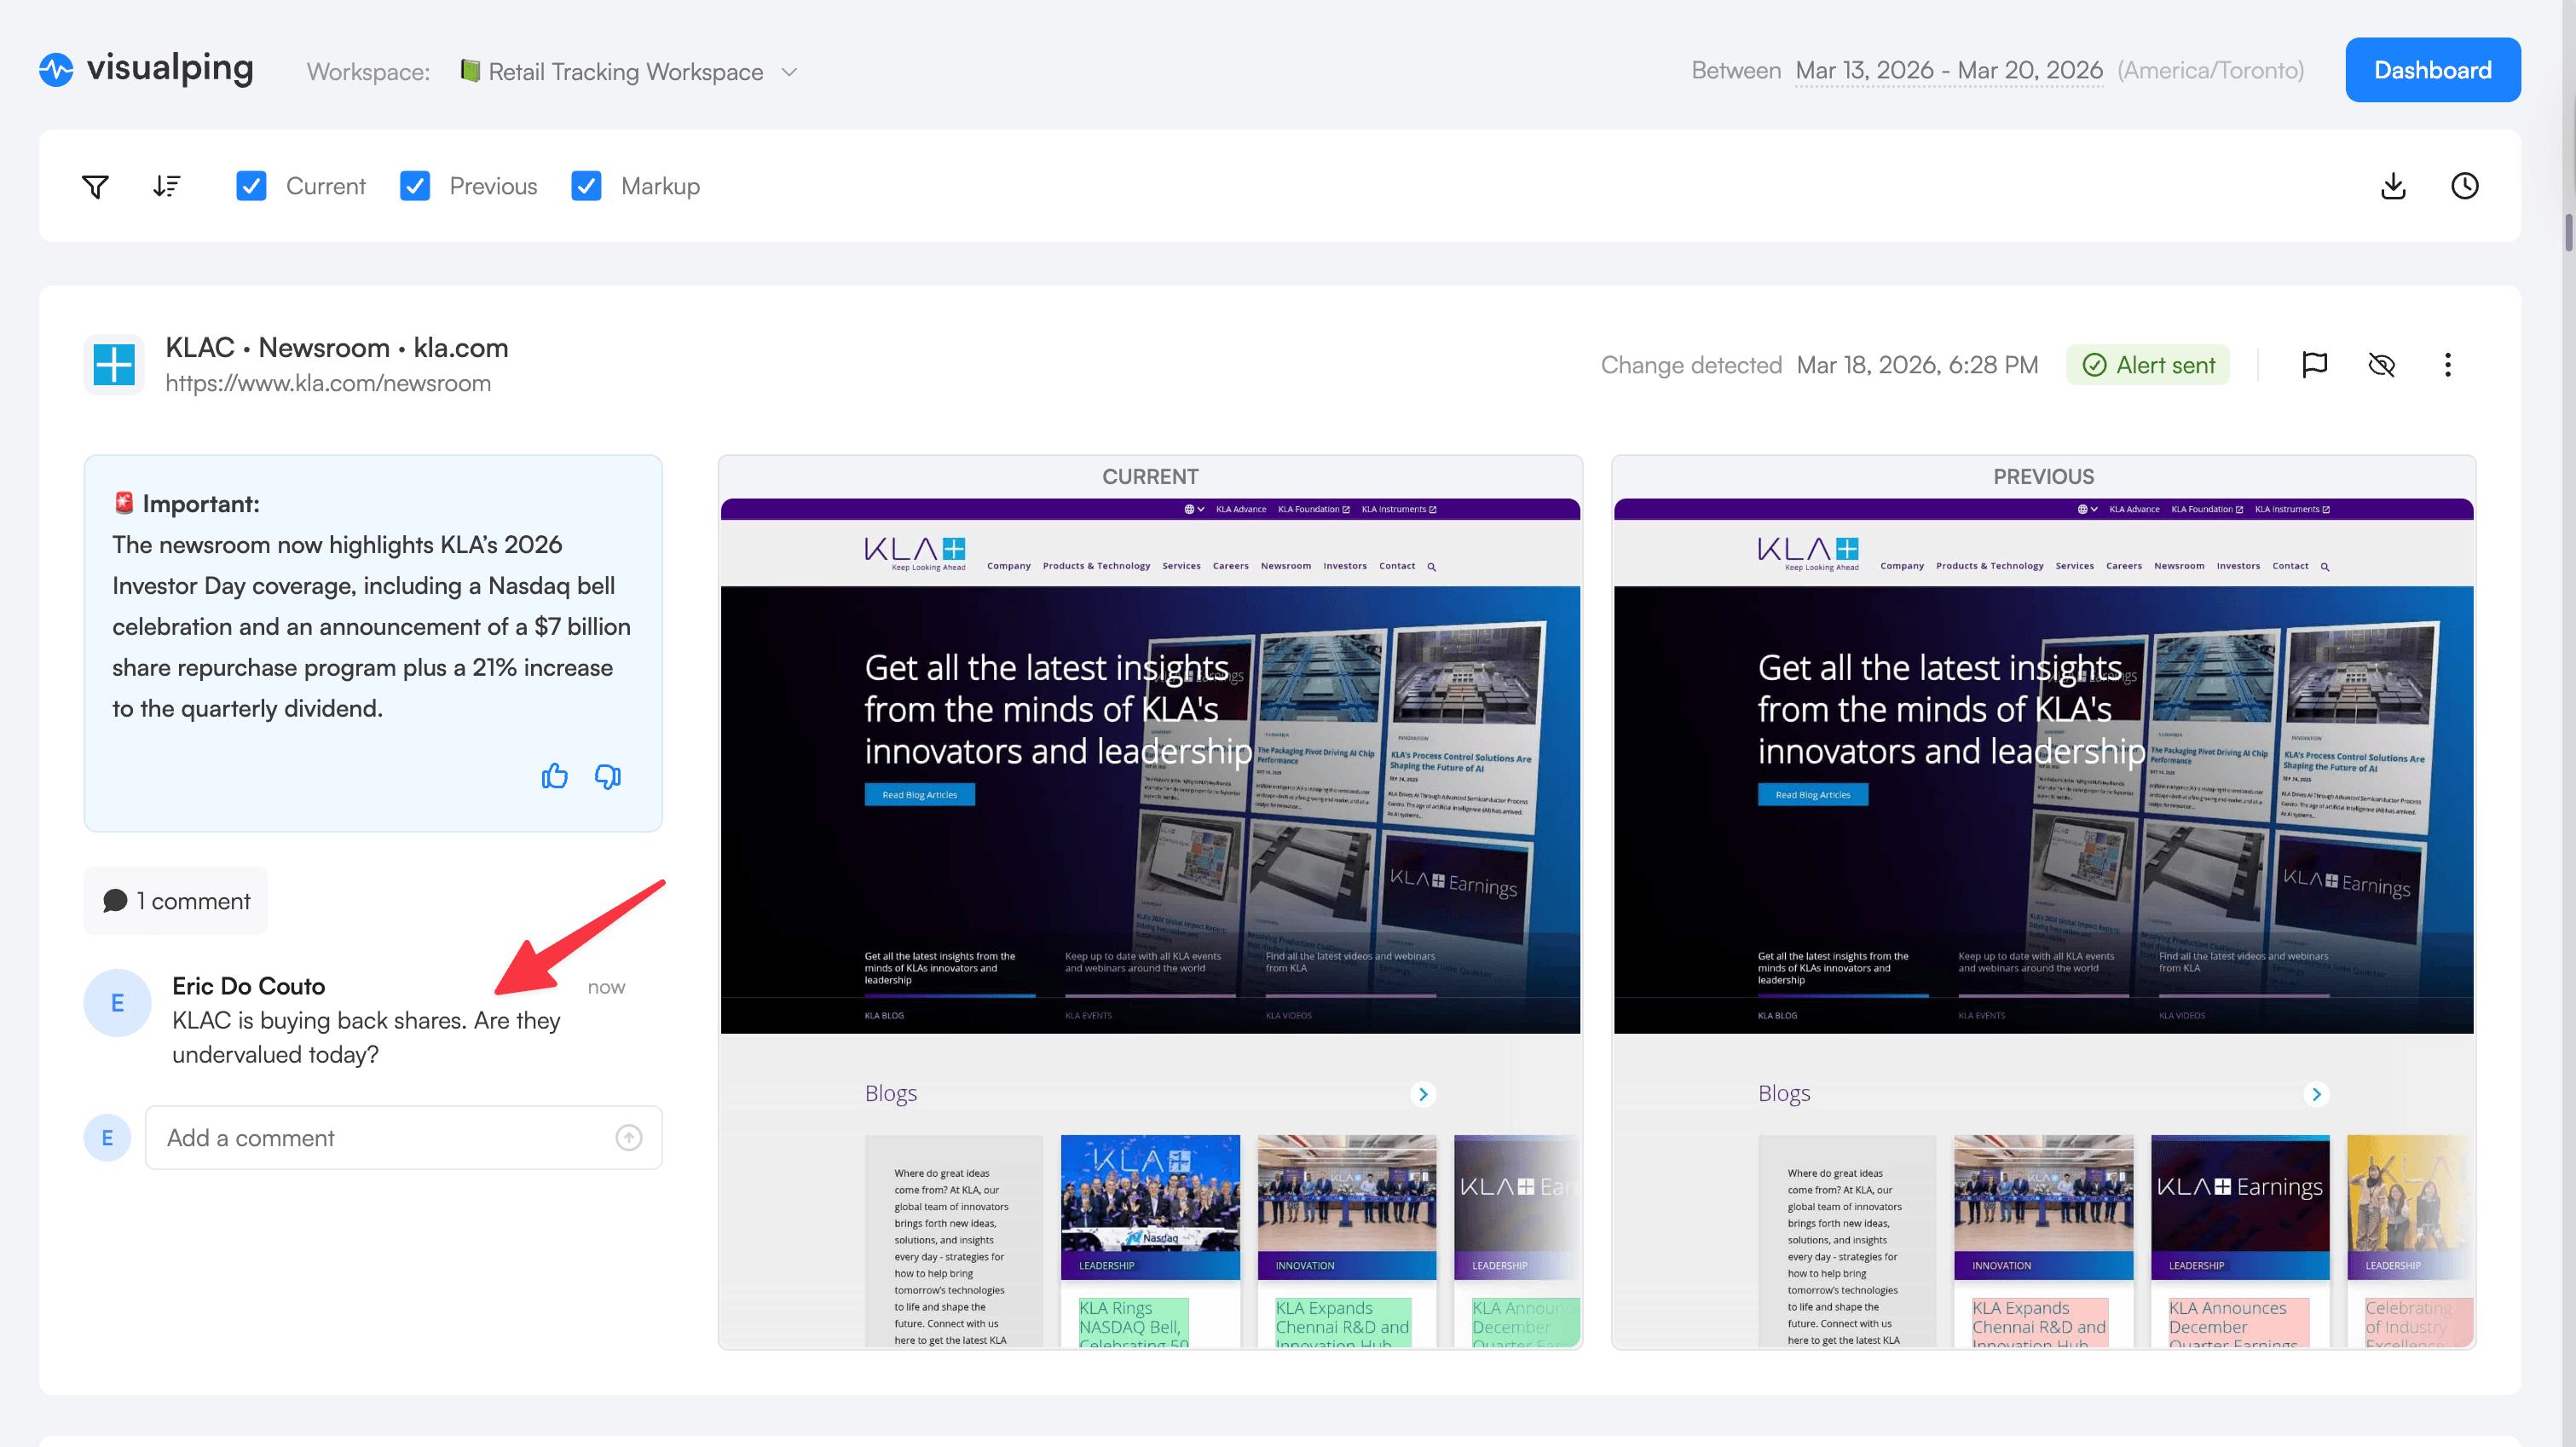
Review individual change entries
Below the AI summary, each detected change gets its own entry. Here's what you'll see for each one:
- Source URL. The page being monitored, shown with the job name you assigned (e.g., "Dad Gang Co. | Competitor Ad Library Monitor").
- Change detected. The timestamp of when Visualping spotted the change.
- Alert sent. A green checkmark confirming the alert was delivered.
- Change Summary. A box with an importance flag and an AI-generated description explaining what specifically changed on the page.
- Visual diffs. Side-by-side CURRENT and PREVIOUS screenshots showing the actual visual changes (and Markup if you enabled it).
Annotate and discuss changes
The report isn't just something you read. It's where your team works through findings together.
Below each change entry, you'll find an "Add a comment" field. Type a comment to share your analysis, ask a question, or document a decision. Other workspace members see your comment in context, right next to the visual diff and AI summary for that change. Replies create a threaded discussion on the specific change you're referencing.
You can also react to the AI-generated change summary with a thumbs up or thumbs down, giving your team a quick signal on whether the AI's assessment was useful.
Two additional actions help your team manage the report:
- Flag. Mark a change as needing attention from the team. Flagged changes stand out so nothing important gets lost in a long report.
- Hide. Remove irrelevant changes from the active view. Hidden changes stay in the report data but stop cluttering the workspace. Useful for filtering out noise like footer updates or cookie banner changes.
Search and filter
At the top of the report, a search bar with a filter icon lets you narrow down results. If your report covers dozens of monitored pages, this is how you zero in on the ones that matter most to you right now.
What to do with what you find
The report gives you the intelligence. Here's how to turn it into action.
Competitor pricing change? Flag it and comment with your recommended response directly on the change entry. Your pricing team sees the context, the visual diff, and your note in one place — no need to forward the report and explain what they're looking at.
Regulatory page update? Flag it for your compliance team. Export to PDF for their records, or share the link so they can review the screenshots in full context.
Competitor launched a new case study or repositioned their messaging? Send the AI summary to product marketing. The pattern analysis often catches competitive positioning shifts that individual alerts wouldn't reveal on their own.
Nothing significant changed? That's useful too. You just confirmed your competitive landscape is stable this week, in 2 minutes instead of 30. Daily review teams use comments to document dispositions ("No action — routine footer update") so the team knows every change was reviewed.
The AI summary at the top of every report is designed to be forwardable on its own. Many teams treat it as their internal competitive brief: copy the summary paragraph, paste it into Slack or an email, done.
Go deeper: Competitive intelligence reports without a $16K CI platform | Competitive pricing analysis guide
Export and share
The toolbar at the top of the report view gives you several options for getting your report into other people's hands: download as PDF, Excel, or CSV; share via link or email; or print directly. Recipients don't need a Visualping account to view a shared report. Use whichever format fits your workflow.
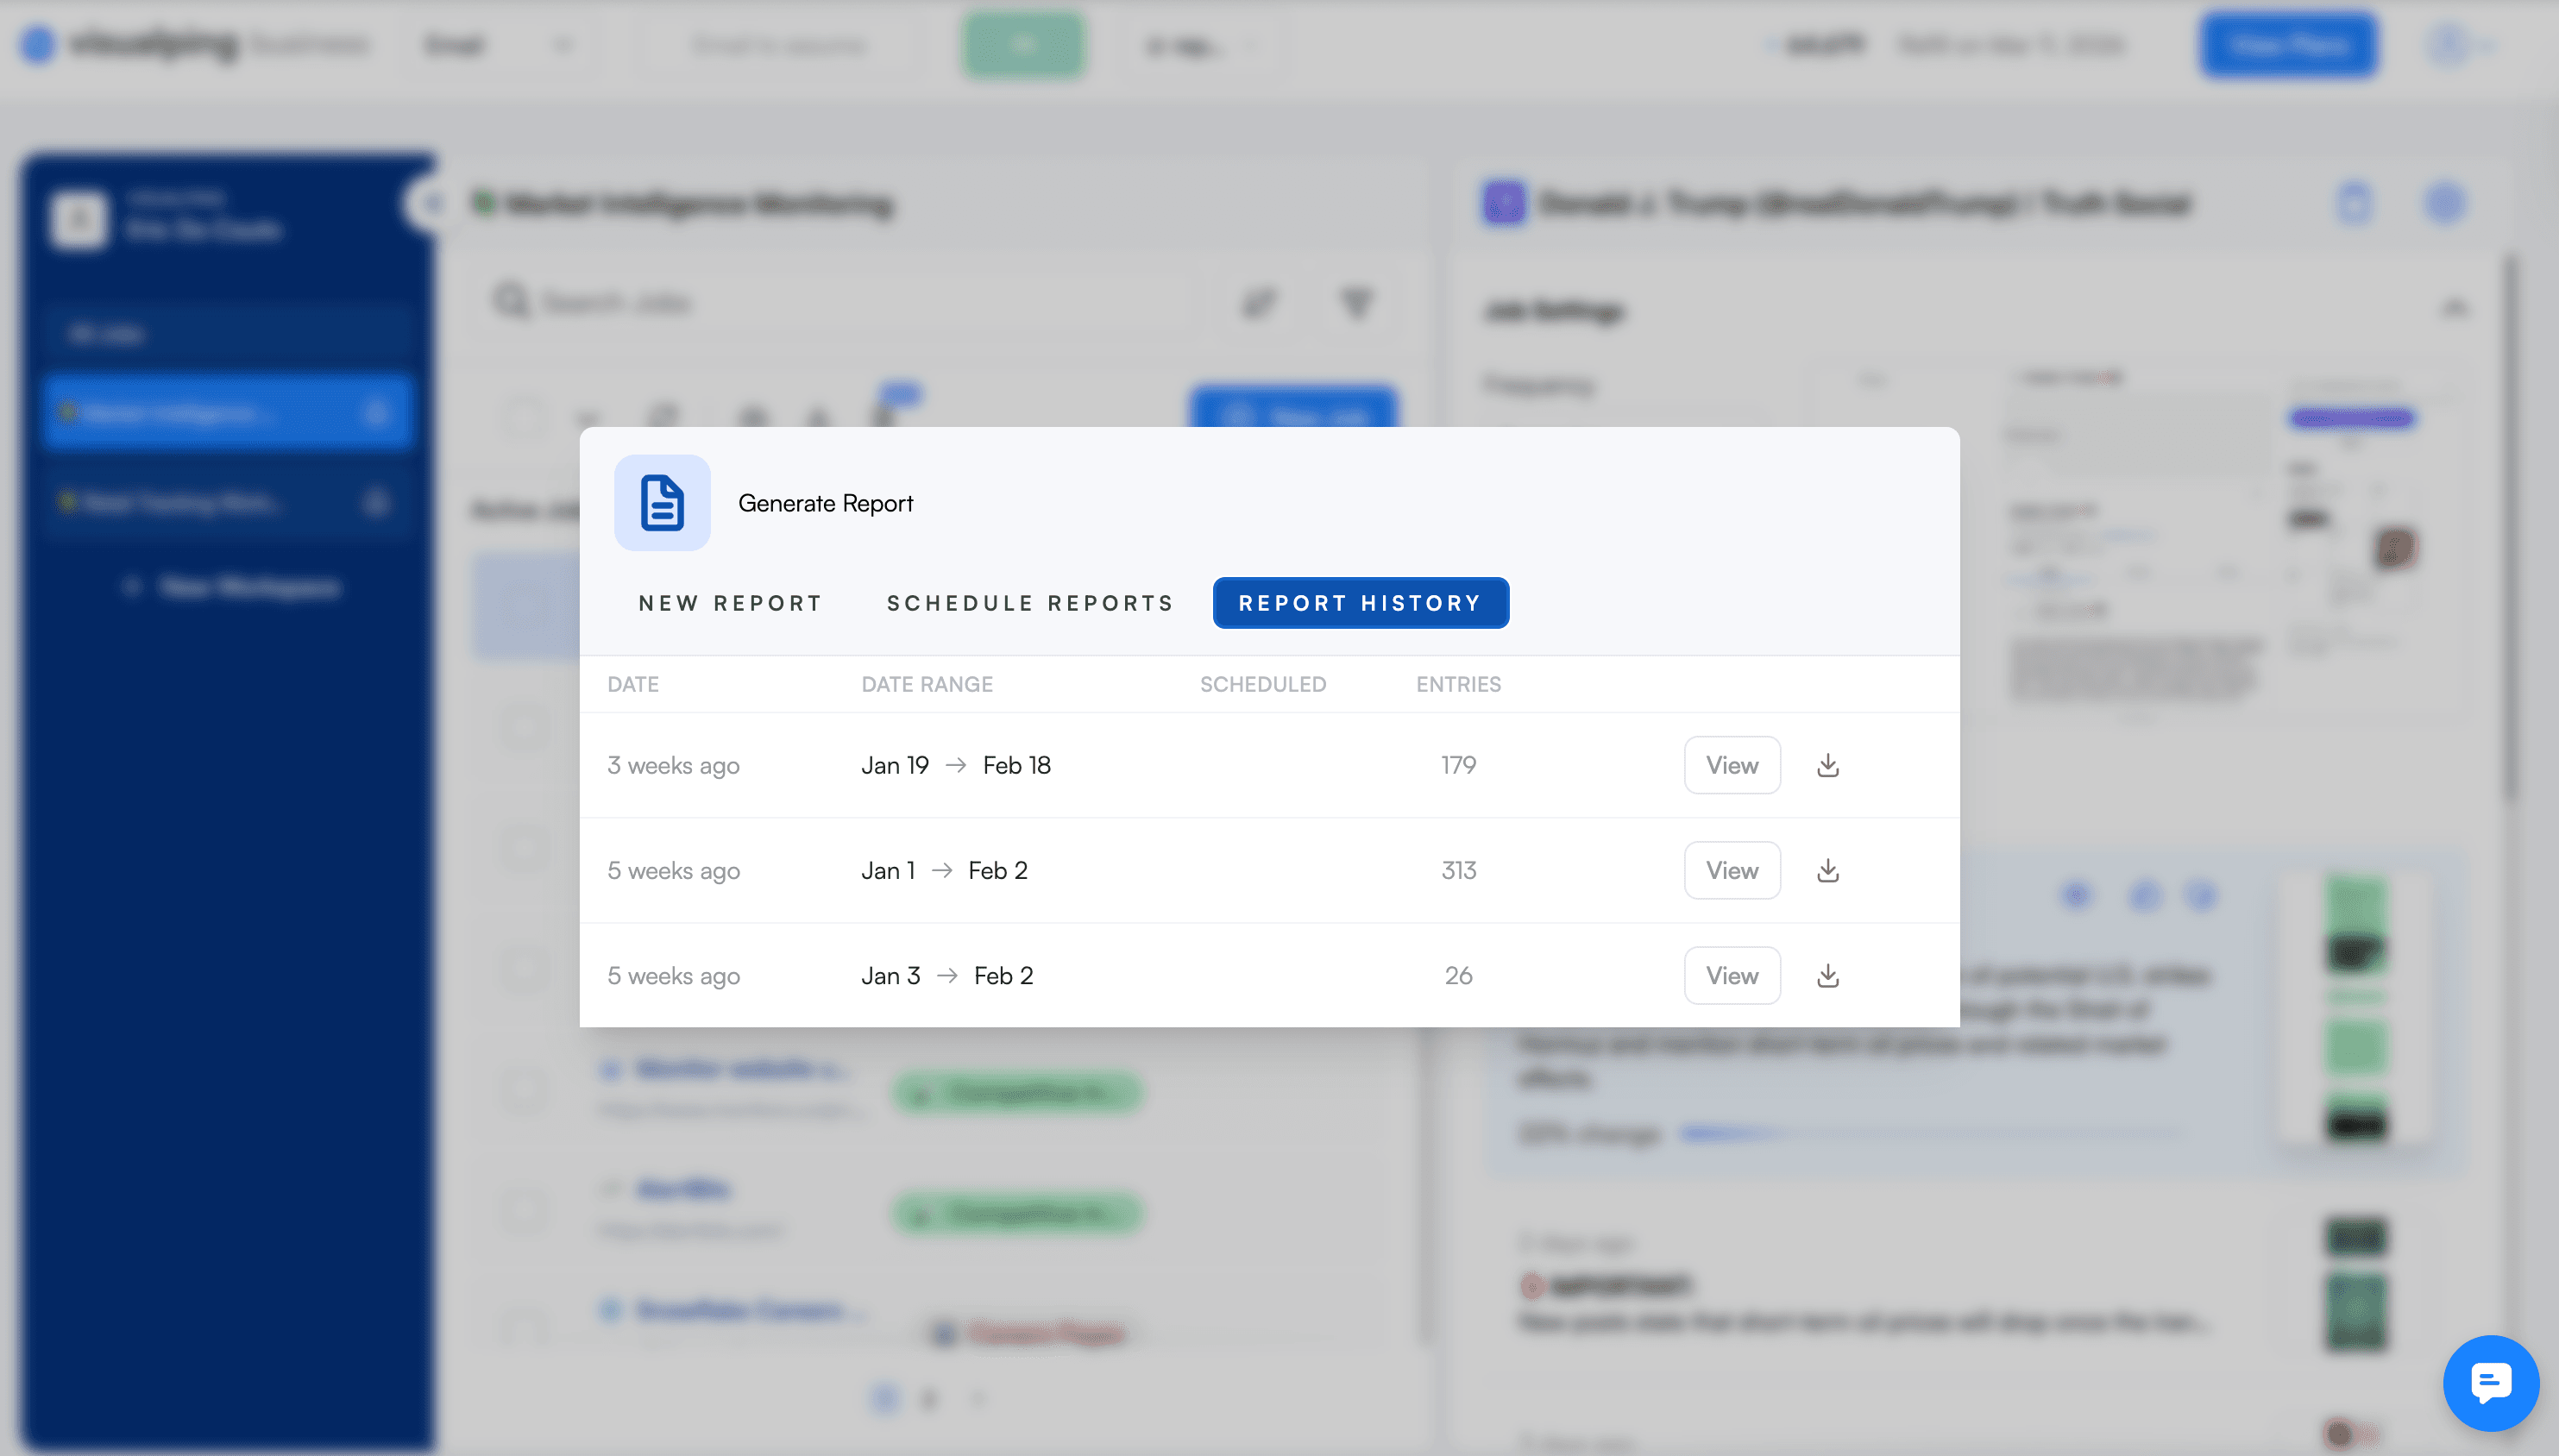
Every report you generate (manual or scheduled) is saved in the Report History tab, where you can re-export, share, or delete it anytime. This creates a chronological record of every briefing your workspace has produced.
Tips for getting the most out of Reports
Once you've created your first Visualping Reports briefing, here are a few ways to sharpen your workflow:
Use "Important Changes" for daily digests and "All Changes" for monthly audits. Your daily report should surface only the things that need your attention right now. Save the exhaustive "All Changes" view for periodic full reviews where completeness matters more than brevity. (See our compliance tracking workflow for a detailed example of when "All Changes" is the right choice.)
Schedule reports for first thing in the morning. Set your scheduled report to generate 15-30 minutes before you typically start work. That way, a fresh summary of overnight changes is ready when you open your inbox.
Lean on the Markup layout to spot differences fast. When you're scanning through dozens of change entries, the highlighted diff view saves you from squinting at two near-identical screenshots trying to find what moved. Keep Markup enabled.
Match the export format to your audience. Use PDF for polished client deliverables. Use Excel or CSV for analysts and spreadsheet-oriented teammates. Use link sharing for team leads who just need to scan the highlights. Use print for meeting handouts.
Use job selection or separate workspaces to scope your reports. You can cherry-pick which jobs to include in any report using the checkboxes. For totally separate recurring briefings with different audiences, organizing jobs into separate workspaces is the cleanest approach since scheduled delivery goes to all workspace members.
Use comments for daily review documentation. Teams that annotate each change with a quick disposition ("No action" or "Escalated to legal") build an auditable decision trail alongside the change trail. This is especially valuable for compliance workflows where proving you reviewed each change matters as much as detecting it.
If something doesn't look right
Your report came back empty. This usually means no changes were detected during your selected date range. Try expanding the range to cover a longer period, or check that your monitoring jobs are active and running on a schedule that falls within the window you selected.
The AI summary seems too short or vague. AI summaries work best when there are multiple changes to synthesize. A report covering only one or two minor changes may produce a brief summary. Try generating a report over a longer time period to give the AI more material to analyze.
A monitoring job you expected isn't showing up. Check that the job's checkbox was selected before you generated the report. If the job lives in a different workspace, you'll need to switch workspaces to include it. Check which workspace you're in via the top navigation.
Your scheduled report didn't arrive. First, verify the schedule is active. The Schedule Reports tab will show a countdown to the next delivery. Then check your spam folder. If the schedule shows active but no email arrived, contact support with your workspace name and the scheduled delivery time.
The visual diffs look blank or identical. Some changes are invisible in screenshots (for example, backend metadata, alt text, or source code changes). If the AI summary and Change Summary describe a change but the screenshots look the same, the change likely happened in a part of the page that isn't visually rendered.
Frequently asked questions
Do I need a Business plan to use Visualping Reports? Yes. Visualping Reports is included free with all Business plans. If you're on a Personal plan, there is a 14-day free Business trial. Your existing monitors and alerts stay exactly as they are during the trial.
Can I select specific monitoring jobs for a report? Yes. Before generating any report, use the checkboxes in your job list to select which jobs to include. You can select all jobs or pick specific ones. This works for both one-time and scheduled recurring reports.
What does "Report Summary & Analysis" do? When toggled on, Visualping's AI reads across all detected changes in your selected jobs and writes a summary at the top of the report. It identifies patterns like pricing shifts across competitors, messaging changes, and new content themes. Without it, you still get individual change entries and visual diffs, but no synthesized overview.
Who receives scheduled reports? Scheduled reports are delivered to all users in the workspace. You cannot pick individual recipients. If different people need different reports, organize your monitoring jobs into separate workspaces.
Can I generate a report for a custom date range? Yes. On the New Report screen, set any start and end date. This is useful for quarterly reviews, board presentations, or compliance audits covering a specific time window.
What's the difference between "Important Changes" and "All Changes"? "Important Changes" uses AI to filter down to changes Visualping has flagged as significant, cutting out minor edits like footer updates. "All Changes" includes everything detected during the date range. Use "Important Changes" for daily digests and "All Changes" for compliance audits or thorough reviews where completeness matters.
Can other workspace members see my comments and annotations? Yes. Comments, flags, and hidden changes are visible to all workspace members who can access the report. This makes annotations a shared workspace for team discussion, not a private note-taking tool.
Ready to try it?
Head to your Reports tab and create your first one. It takes under two minutes. Start with a one-time report to see what you get, then set up a daily schedule so you never miss a pattern again. Looking for workflow inspiration? See 5 workflows built on Visualping Reports for competitive intelligence, compliance, agency, e-commerce, and executive use cases.
Open Reports in your workspace → Included free with all Business plans.
Reports is one of several features that shipped in Q1 2026, including a native Zapier app and self-serve API keys. See the full Q1 2026 release recap for details.
Want to monitor web changes that impact your business?
Sign up with Visualping to get alerted of important updates from anywhere online.
The Visualping Team
The Visualping Team is the content and product marketing group at Visualping, a leading platform for website change detection and competitive intelligence. We write about automation, web monitoring, and tools that help businesses stay ahead.