Top 8 Equity Research Tools for Analysts in 2026
By The Visualping Team
Updated January 29, 2025

Last updated: March 2026
Bloomberg Terminal costs $25,000/year. These 8 equity research tools cover similar ground at a fraction of the cost, and some are free.
Editor's note: Visualping is our product. For institutional-grade fundamental analysis with financial models, screening, and multi-asset data, FactSet and Morningstar Direct are the industry standard. For affordable charting and visualization without a terminal-grade subscription, Koyfin covers most analyst needs. Visualping monitors web pages for changes - it does not provide financial data feeds, stock screening, or valuation models. It complements research tools by catching filing updates and earnings changes on source websites, but it is not an equity research platform itself. Review each tool's limitations, including ours.
| Tool | Best for | Starting price |
|---|---|---|
| Visualping | Web monitoring for IR pages, filings, press releases | $50/month |
| Quodd | Real-time price and volume data across exchanges | $12,000/year |
| Morningstar Direct | Mutual fund and ETF analysis, asset allocation | $10,000/year |
| YCharts | Data visualization, custom reports | $600/month |
| FactSet | Financial modeling, integrated multi-asset data | $12,000/year |
| Koyfin | Global equity charting, macro indicators | Free / $100/month |
| Bloomberg Terminal | Full-spectrum terminal (equities, FI, commodities) | $20,000/year |
| CapitalCube | Automated fundamental analysis, ML-driven ratings | $15,000/year |
Whether you're running long, short, or event-driven strategies, equity research means living inside a handful of companies. Analysts own a small coverage universe within one industry and need the right investment research platforms to pull market data, spot events early, and keep their stock market research current.
According to Grand View Research, the financial analytics market reached $12.2 billion in 2024 and is projected to grow at 10.3% CAGR through 2030, driven partly by demand for specialized equity research tools that go beyond traditional terminals.
Below: what each tool actually does, who it's built for, and what it costs.
The top 8 equity research tools compared
1. Visualping
Visualping is a page monitoring agent that watches any web page and pings you when something changes.
For equity analysts, that means locking onto the web sources that matter for your coverage: product prices, executive team pages, press releases, shareholder data. When a page updates, you know about it before the rest of the market catches up.
Best for
Equity researchers, associates, and analysts looking to supplement their equity research with granular web data from specific web sources of interest. Particularly compatible with fundamental analysis and event-driven strategies.
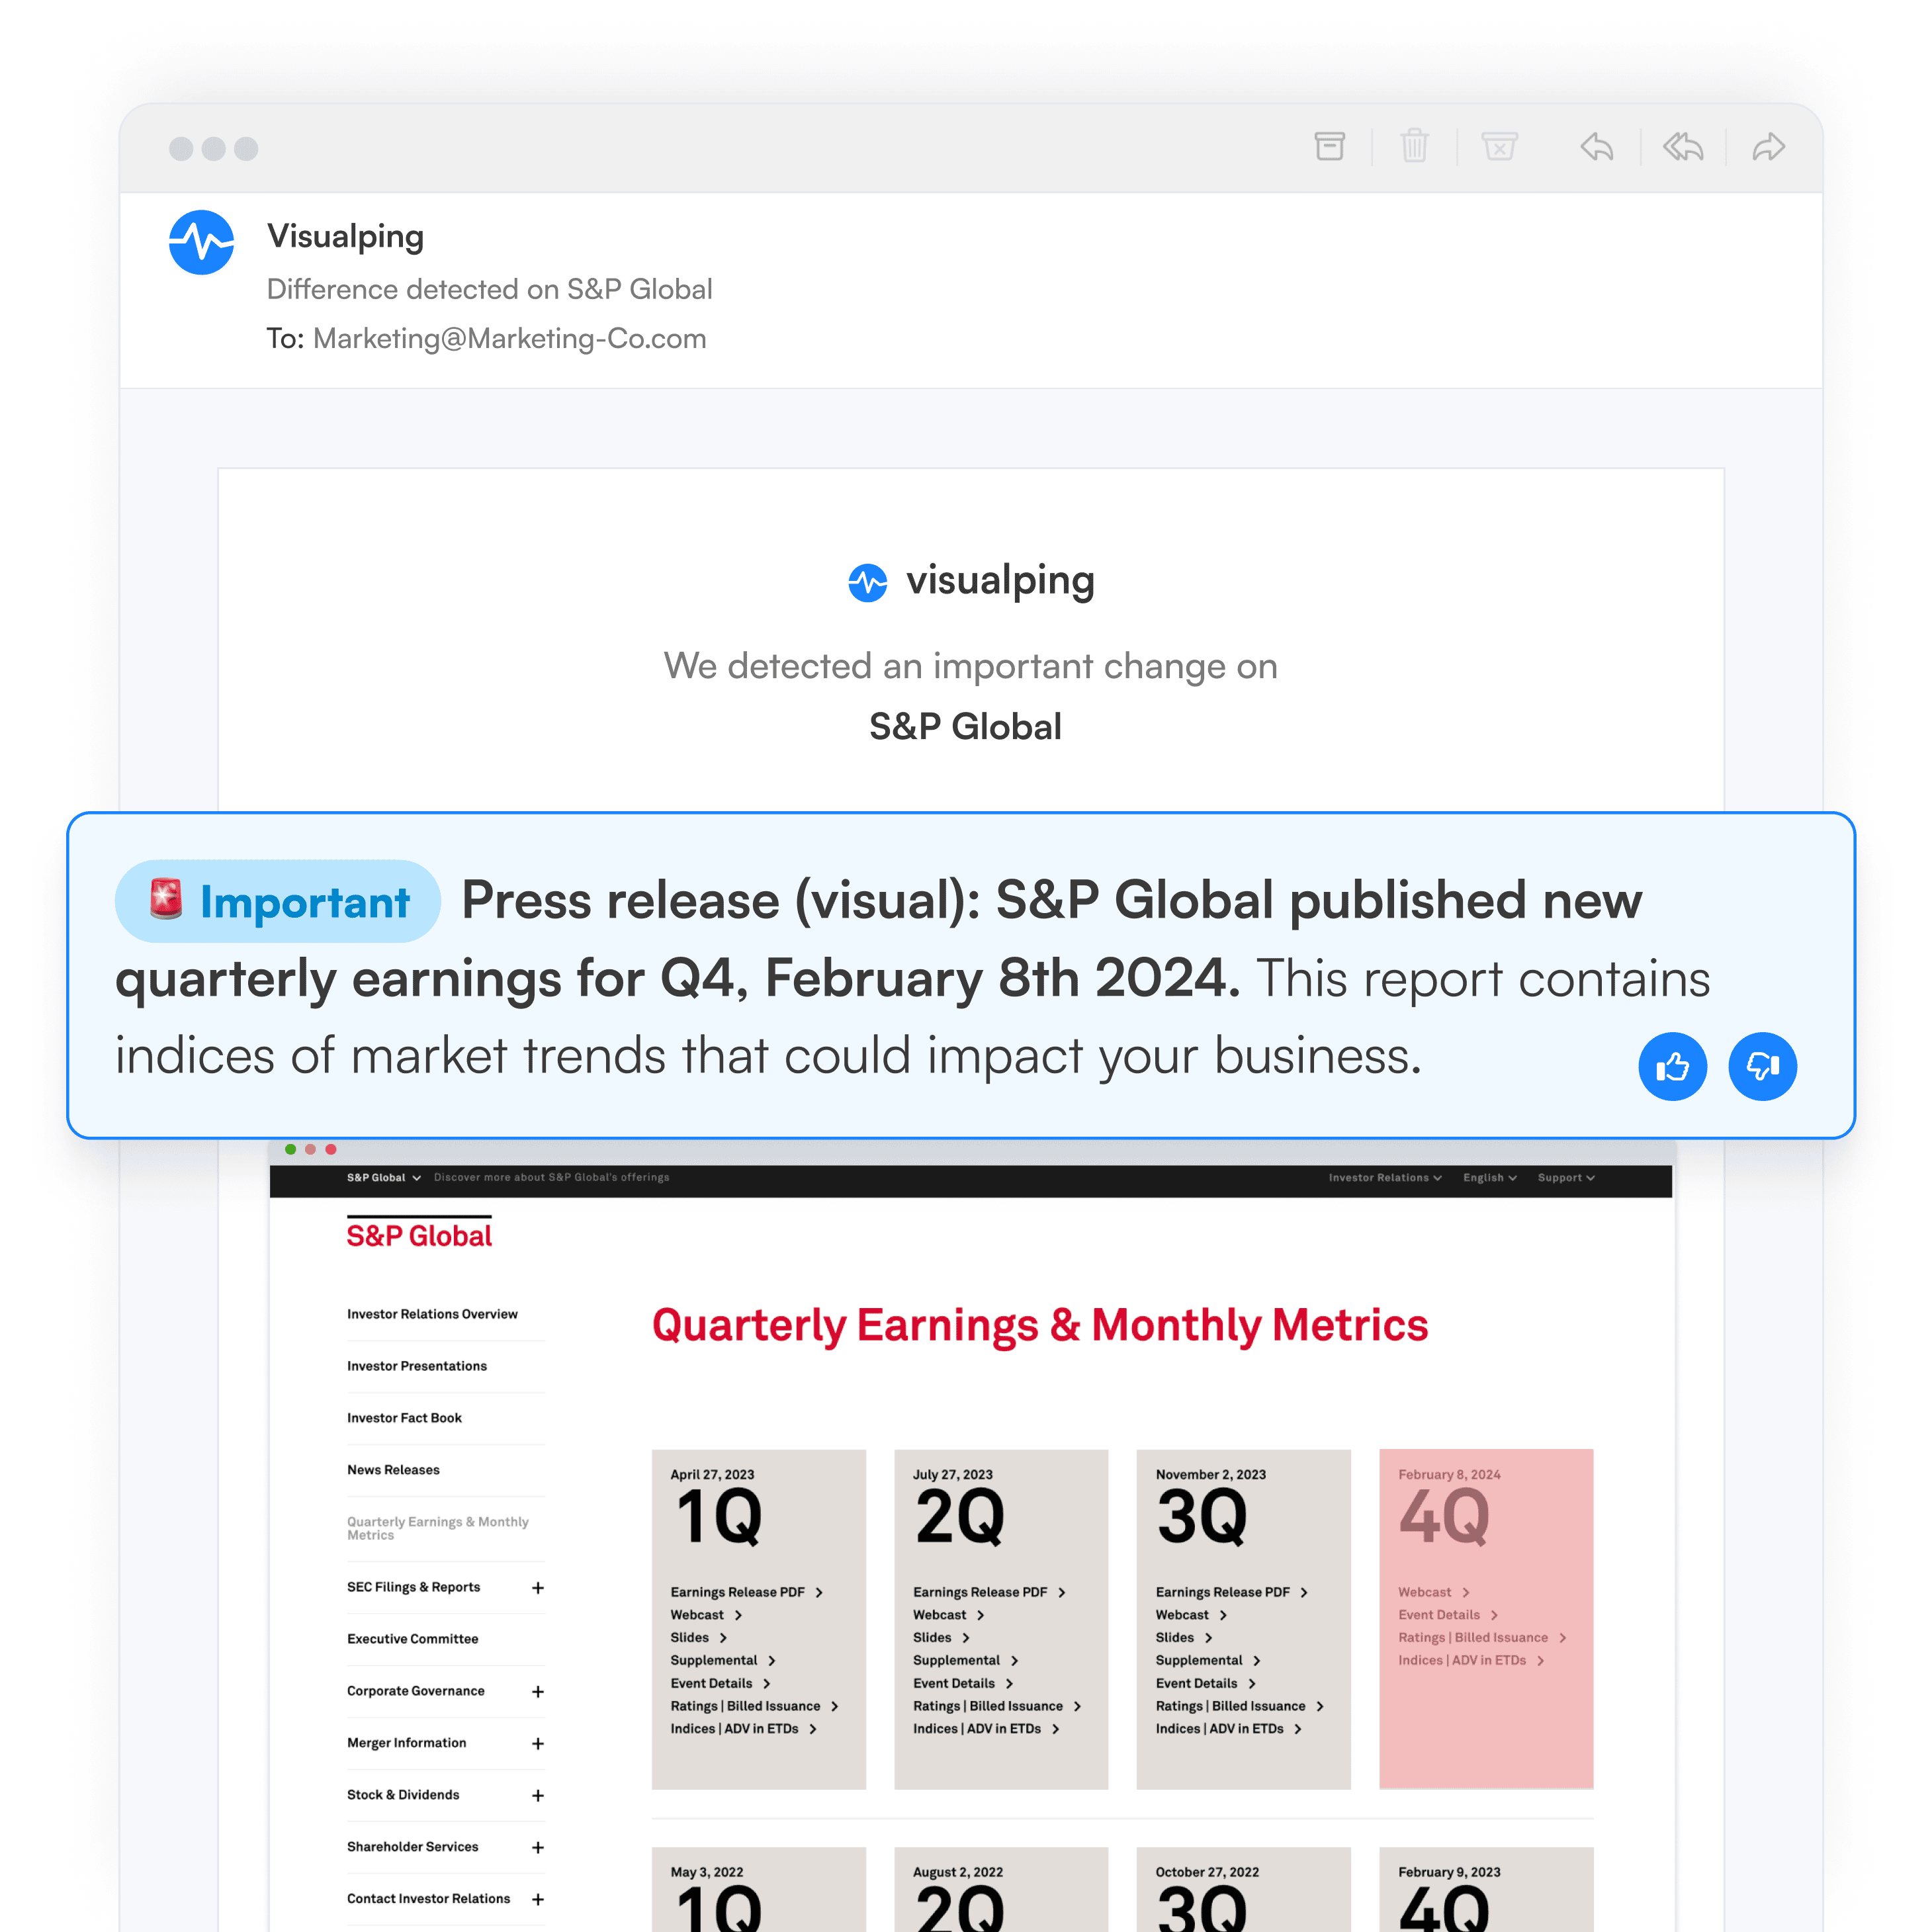
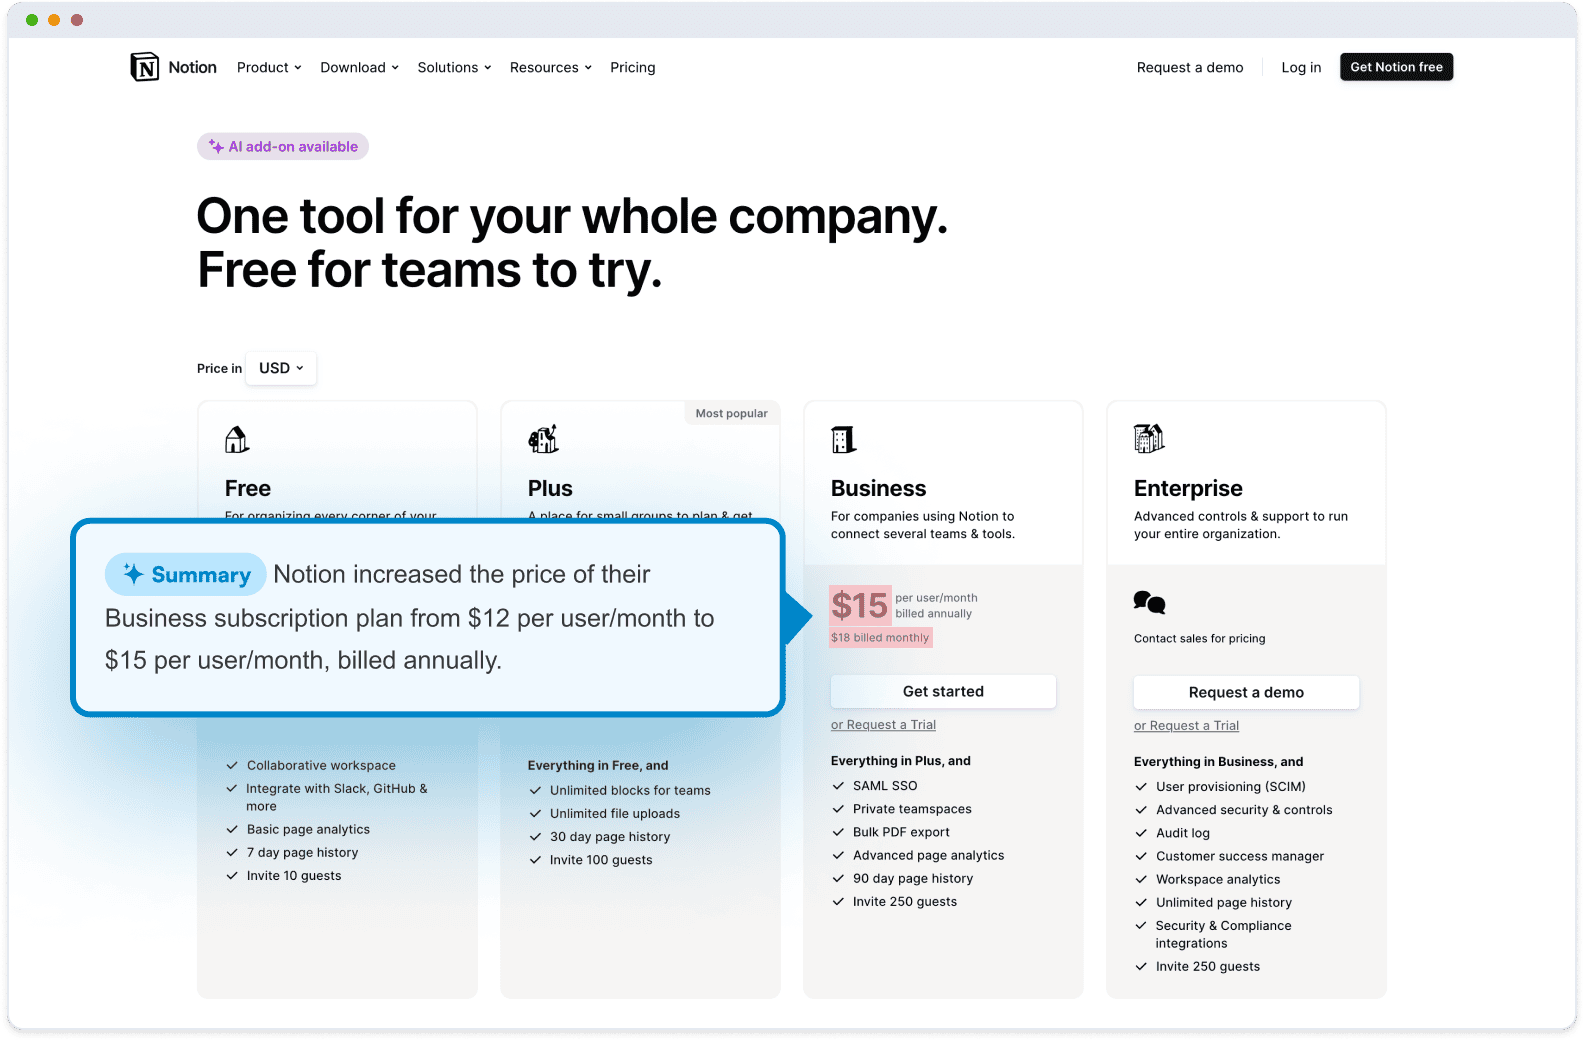
When an update occurs, you get an email alert that includes an AI-generated summary of the change, distilled in two to three lines. The alert also includes a screenshot of the page, with the changes highlighted.
In terms of what you can track, from its database of over a hundred thousand web sources, Visualping's team imports a custom set of web sources that match your criteria (such as the financial data you're after, related to your focus area and industry).
You can also add your own web sources. Visualping's team will set up the monitoring for you.
Top features
- Limitless content scope: You can monitor any public web source for updates. Be the only one to monitor the pages key to your investment thesis.
- Real-time alerts: Get notified of a change two minutes after it occurs online.
- Cut through the noise with AI: Only get notified of updates that match your custom criteria, such as certain keywords or financial data, so you're not sifting through irrelevant alerts.
- Integrations: Visualping extracts data from web pages as information changes, plugging directly into your models.
Pricing
Business plans include real-time monitoring, popular integrations (like Google Sheets and Slack), and bulk monitoring. Plans start at $50/month.
For customized AI alerts, dedicated service, and bulk dataset upload, Solutions plans start at $3,000. Get in touch to discuss the best plan for you.
2. Quodd
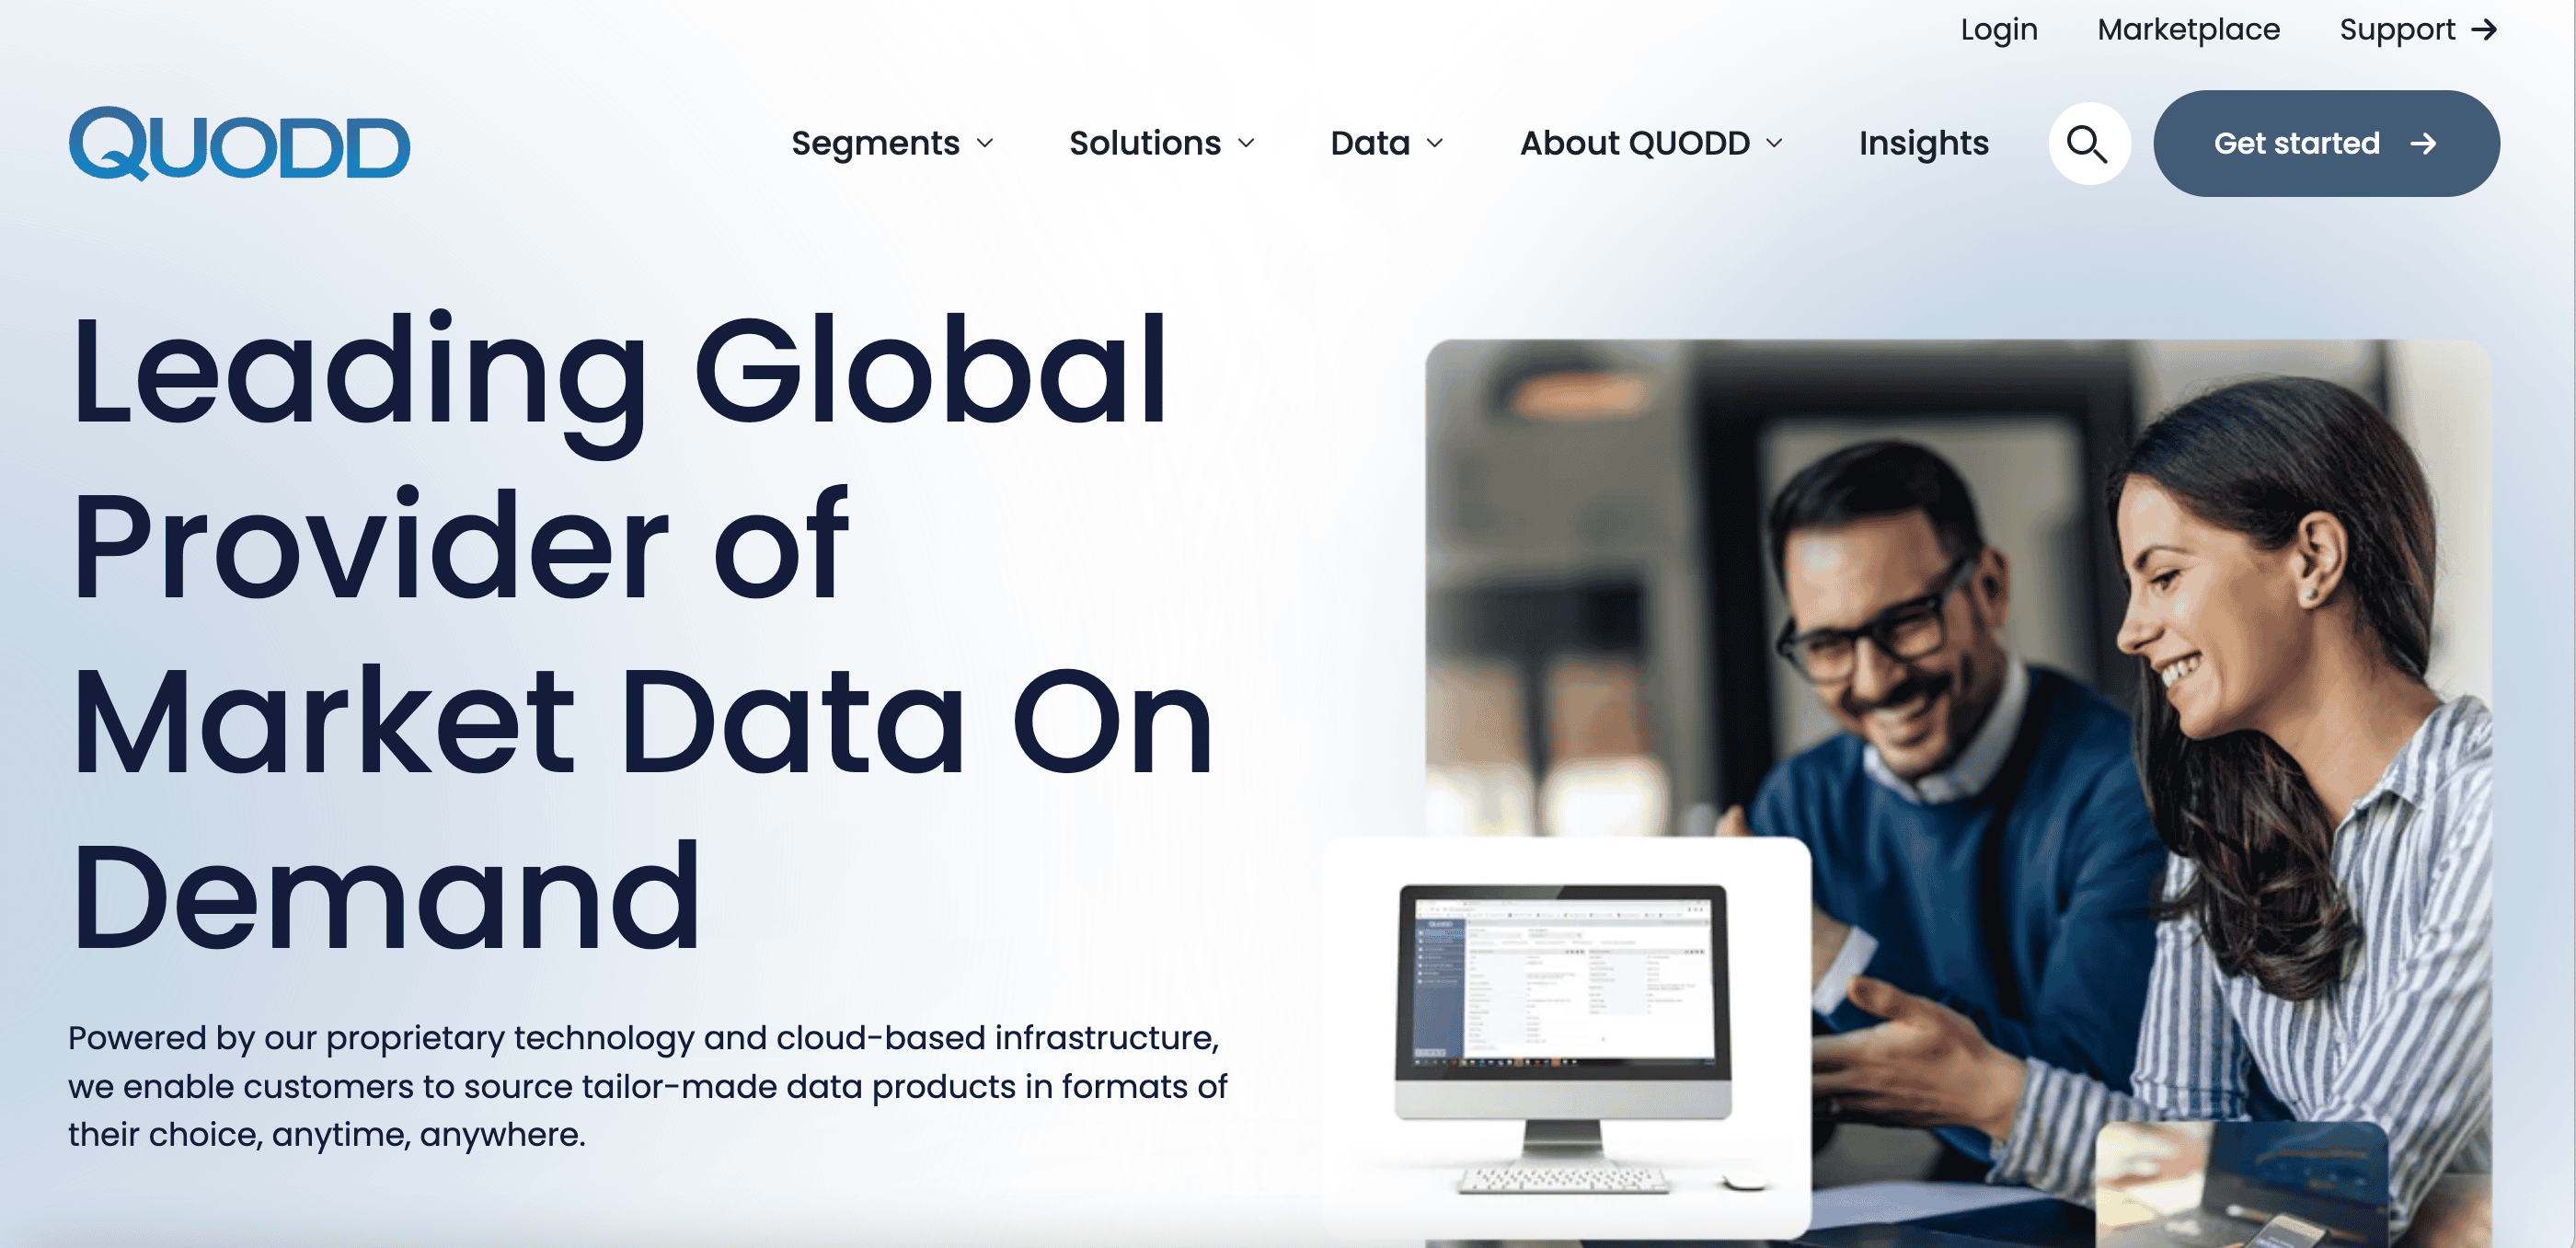
Quodd provides real-time market data, financial information, and news, with a strong emphasis on equities. The platform is designed for investment professionals who need to monitor multiple markets and track changes in real time, with tools for historical analysis, financial modeling, and news aggregation.
Best for
Hedge fund analysts who need real-time price and volume data across multiple exchanges, and portfolio managers looking to track the impact of global events on their investments.
Top features
- Real-time market data: Instant access to equity prices, indices, and market trends across global exchanges.
- Advanced charting and analytics: Detailed tools for technical analysis and data visualization.
- Custom alerts: Set custom alerts for stock price changes or news developments.
Pricing
Pricing is flexible, generally starting at $12,000 to $18,000 per year, depending on the number of users and data packages selected.
3. Morningstar Direct
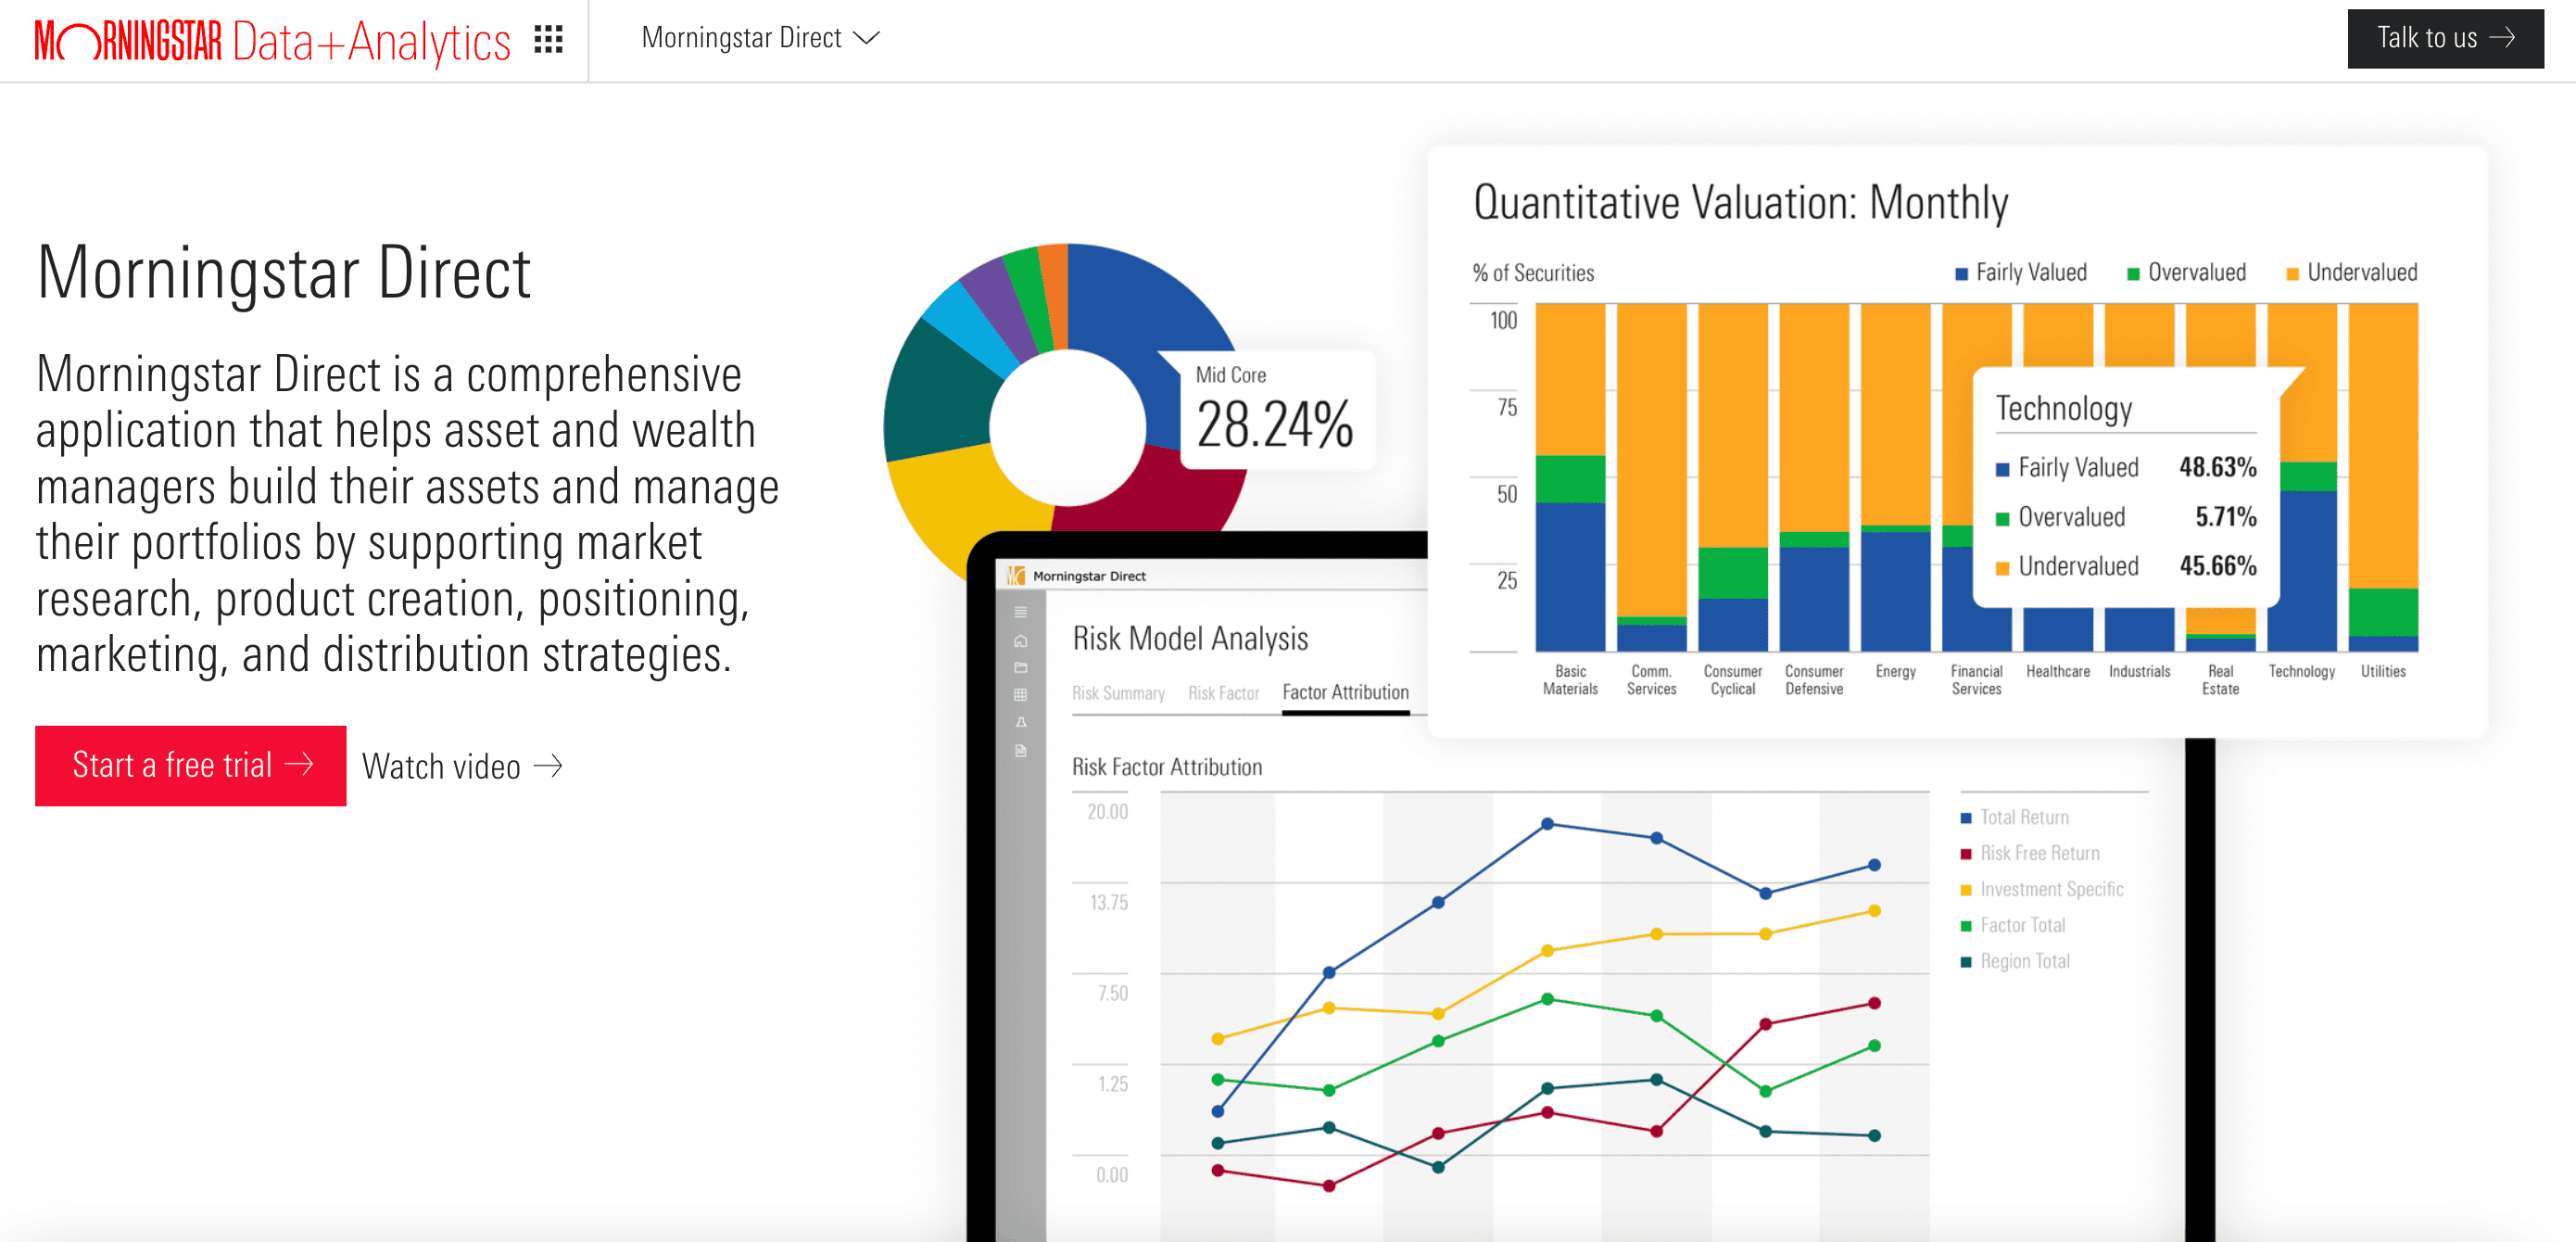
Morningstar Direct is a well-established stock research tool that provides extensive data on mutual funds, stocks, ETFs, and alternative investments. It is known for its in-depth analysis of investment portfolios, risk management tools, and qualitative data on managers and strategies.
Best for
Portfolio managers who need detailed data and performance metrics on asset classes, especially for long-term, strategic investments. Also valuable for data analysts focused on fund performance and asset allocation.
Top features
- Investment performance analytics: Detailed metrics and reports for analyzing portfolio returns and risk.
- Fund data and research: Detailed research on mutual funds, ETFs, and other managed investments.
- Risk and scenario analysis: Tools to assess portfolio risk and run scenario analysis based on market conditions.
Pricing
Pricing starts around $10,000 per year for individual users, with more advanced features and data sets available at a higher price point.
4. YCharts
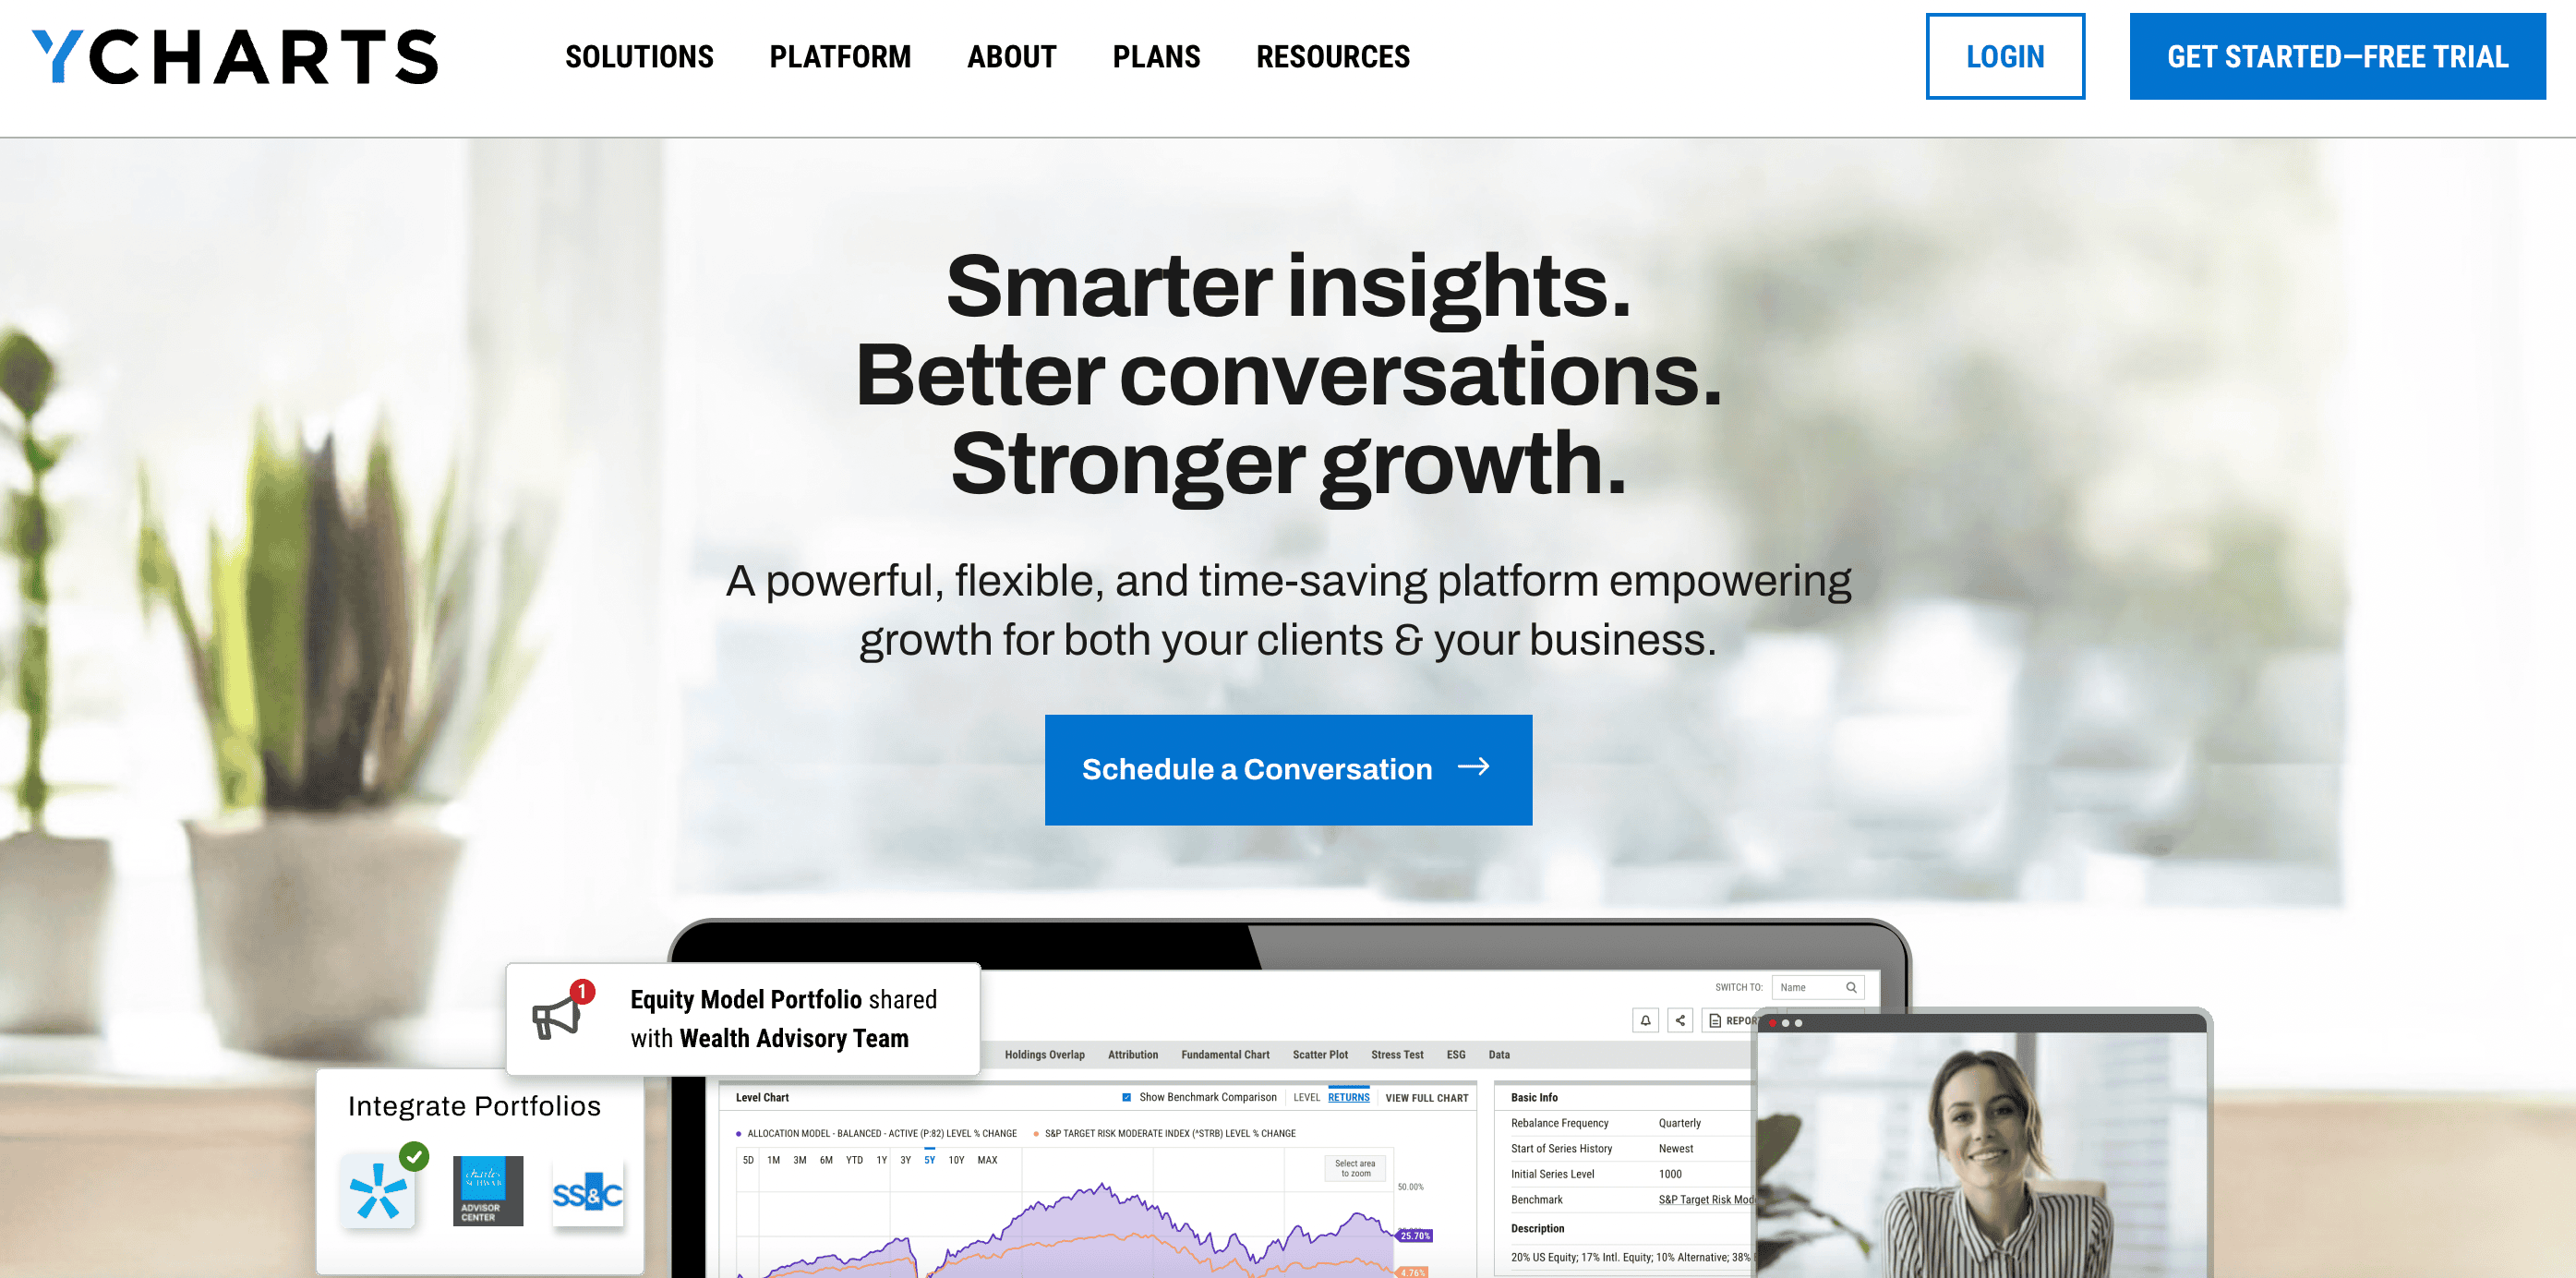
YCharts is a financial research platform that specializes in providing powerful data visualization tools and detailed market analytics. It is particularly popular among financial advisors and analysts for its user-friendly interface and its ability to generate clean, detailed reports.
Best for
Data analysts and portfolio managers who prioritize data visualization. Its clear and easily customizable charts are ideal for quickly presenting complex financial data.
Top features
- Customizable dashboards: Create personalized dashboards to track the metrics that matter most.
- Advanced charting: Detailed charting tools to visually analyze trends and performance.
- Fundamentals and valuation tools: Access key valuation metrics like P/E ratios, DCF, and other financials.
Pricing
Pricing starts at around $600 per month, with plans scaling based on the number of users and features required.
5. FactSet
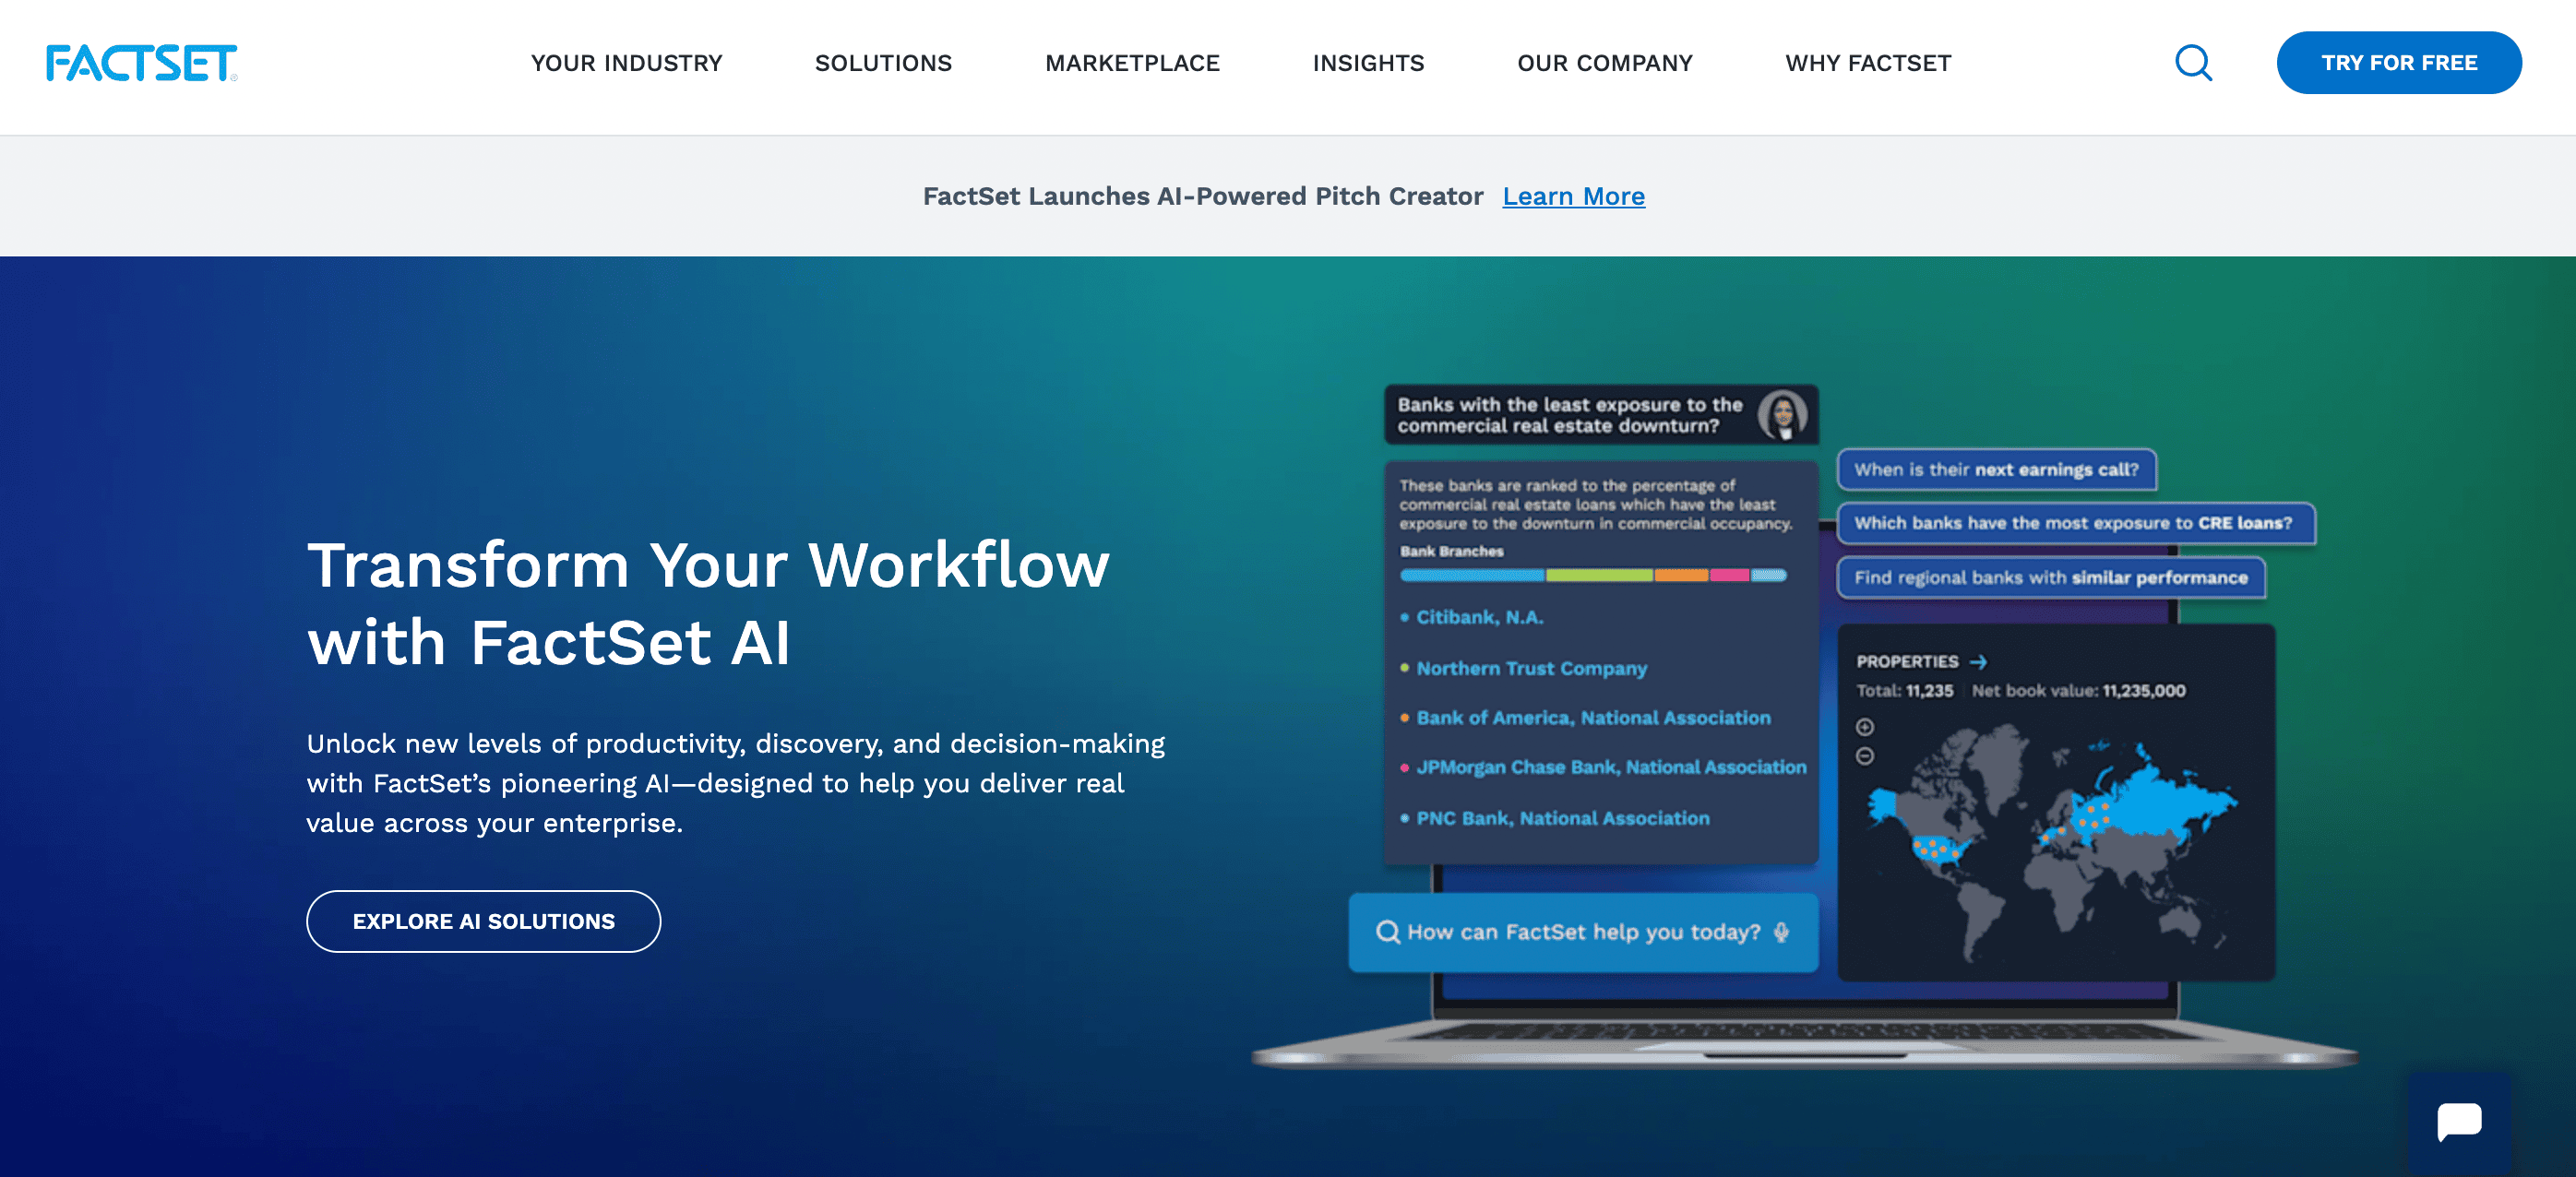
FactSet is a financial data platform used for investment analysis and portfolio management. With a wide range of tools covering equity, fixed income, and alternative assets, it aggregates data from a variety of sources to deliver detailed insights. FactSet's data visualization and analytics capabilities enable in-depth financial modeling and research across multiple asset classes.
Best for
Equity research, financial modeling, and portfolio management. Data analysts benefit from its deep datasets and analytics. Portfolio managers use it to manage portfolios, conduct risk assessments, and monitor market trends.
Top features
- Integrated data sets: Access to global equity data, financials, macroeconomic trends, and alternative data sources.
- Portfolio management tools: Full-featured tools for portfolio construction, risk analysis, and performance evaluation.
- Custom analytics and reporting: Customize reports and analyses to specific investment strategies or themes.
Pricing
Pricing is typically subscription-based and varies depending on the number of users and level of data required, ranging from $12,000 to $20,000 per user annually.
6. Koyfin
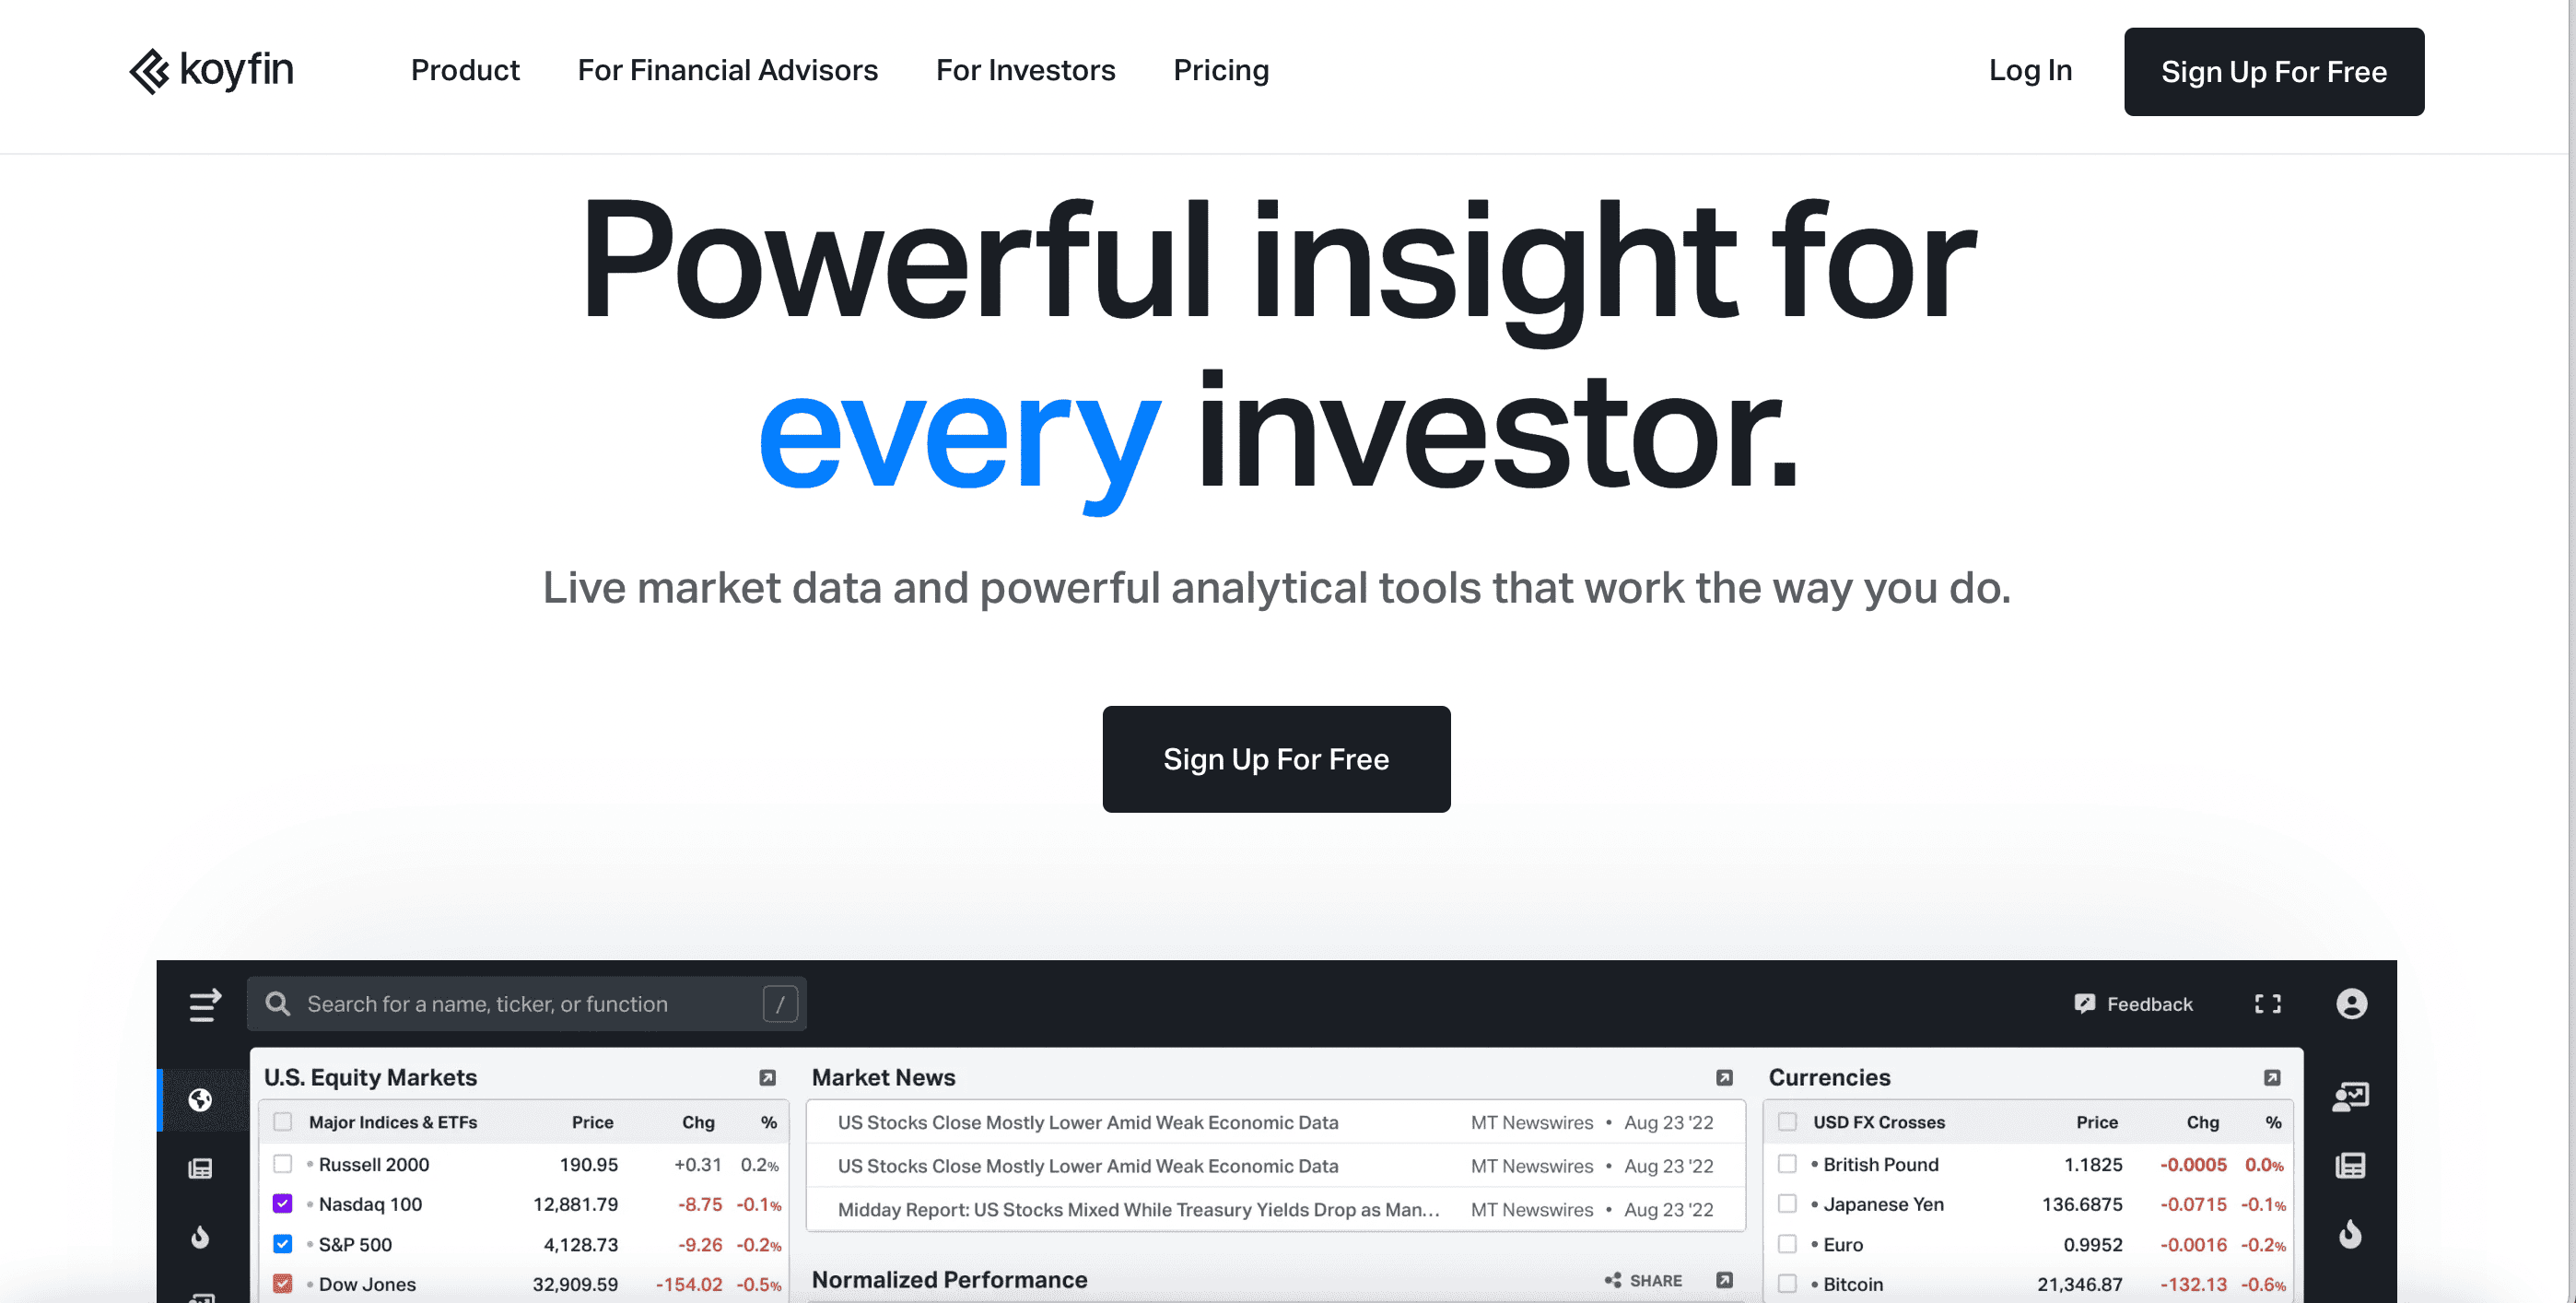
Koyfin is a newer tool that has gained popularity for offering free access to high-quality financial data, advanced charting, and analytics. Its strength lies in providing easy access to global financial data, economic indicators, and fundamental analysis tools.
Best for
Data analysts and smaller hedge funds or independent researchers looking for cost-effective yet powerful financial tools, particularly for global equity and macroeconomic analysis.
Top features
- Global equity data: Access to a wide array of international financial data and performance metrics.
- Advanced charting: Visualize company financials with interactive charts, including technical indicators.
- Economic data and indicators: Access to macroeconomic data and indicators to support broader market analysis.
Pricing
Koyfin offers a free version, with a premium version available starting at $100 per month.
7. Bloomberg Terminal
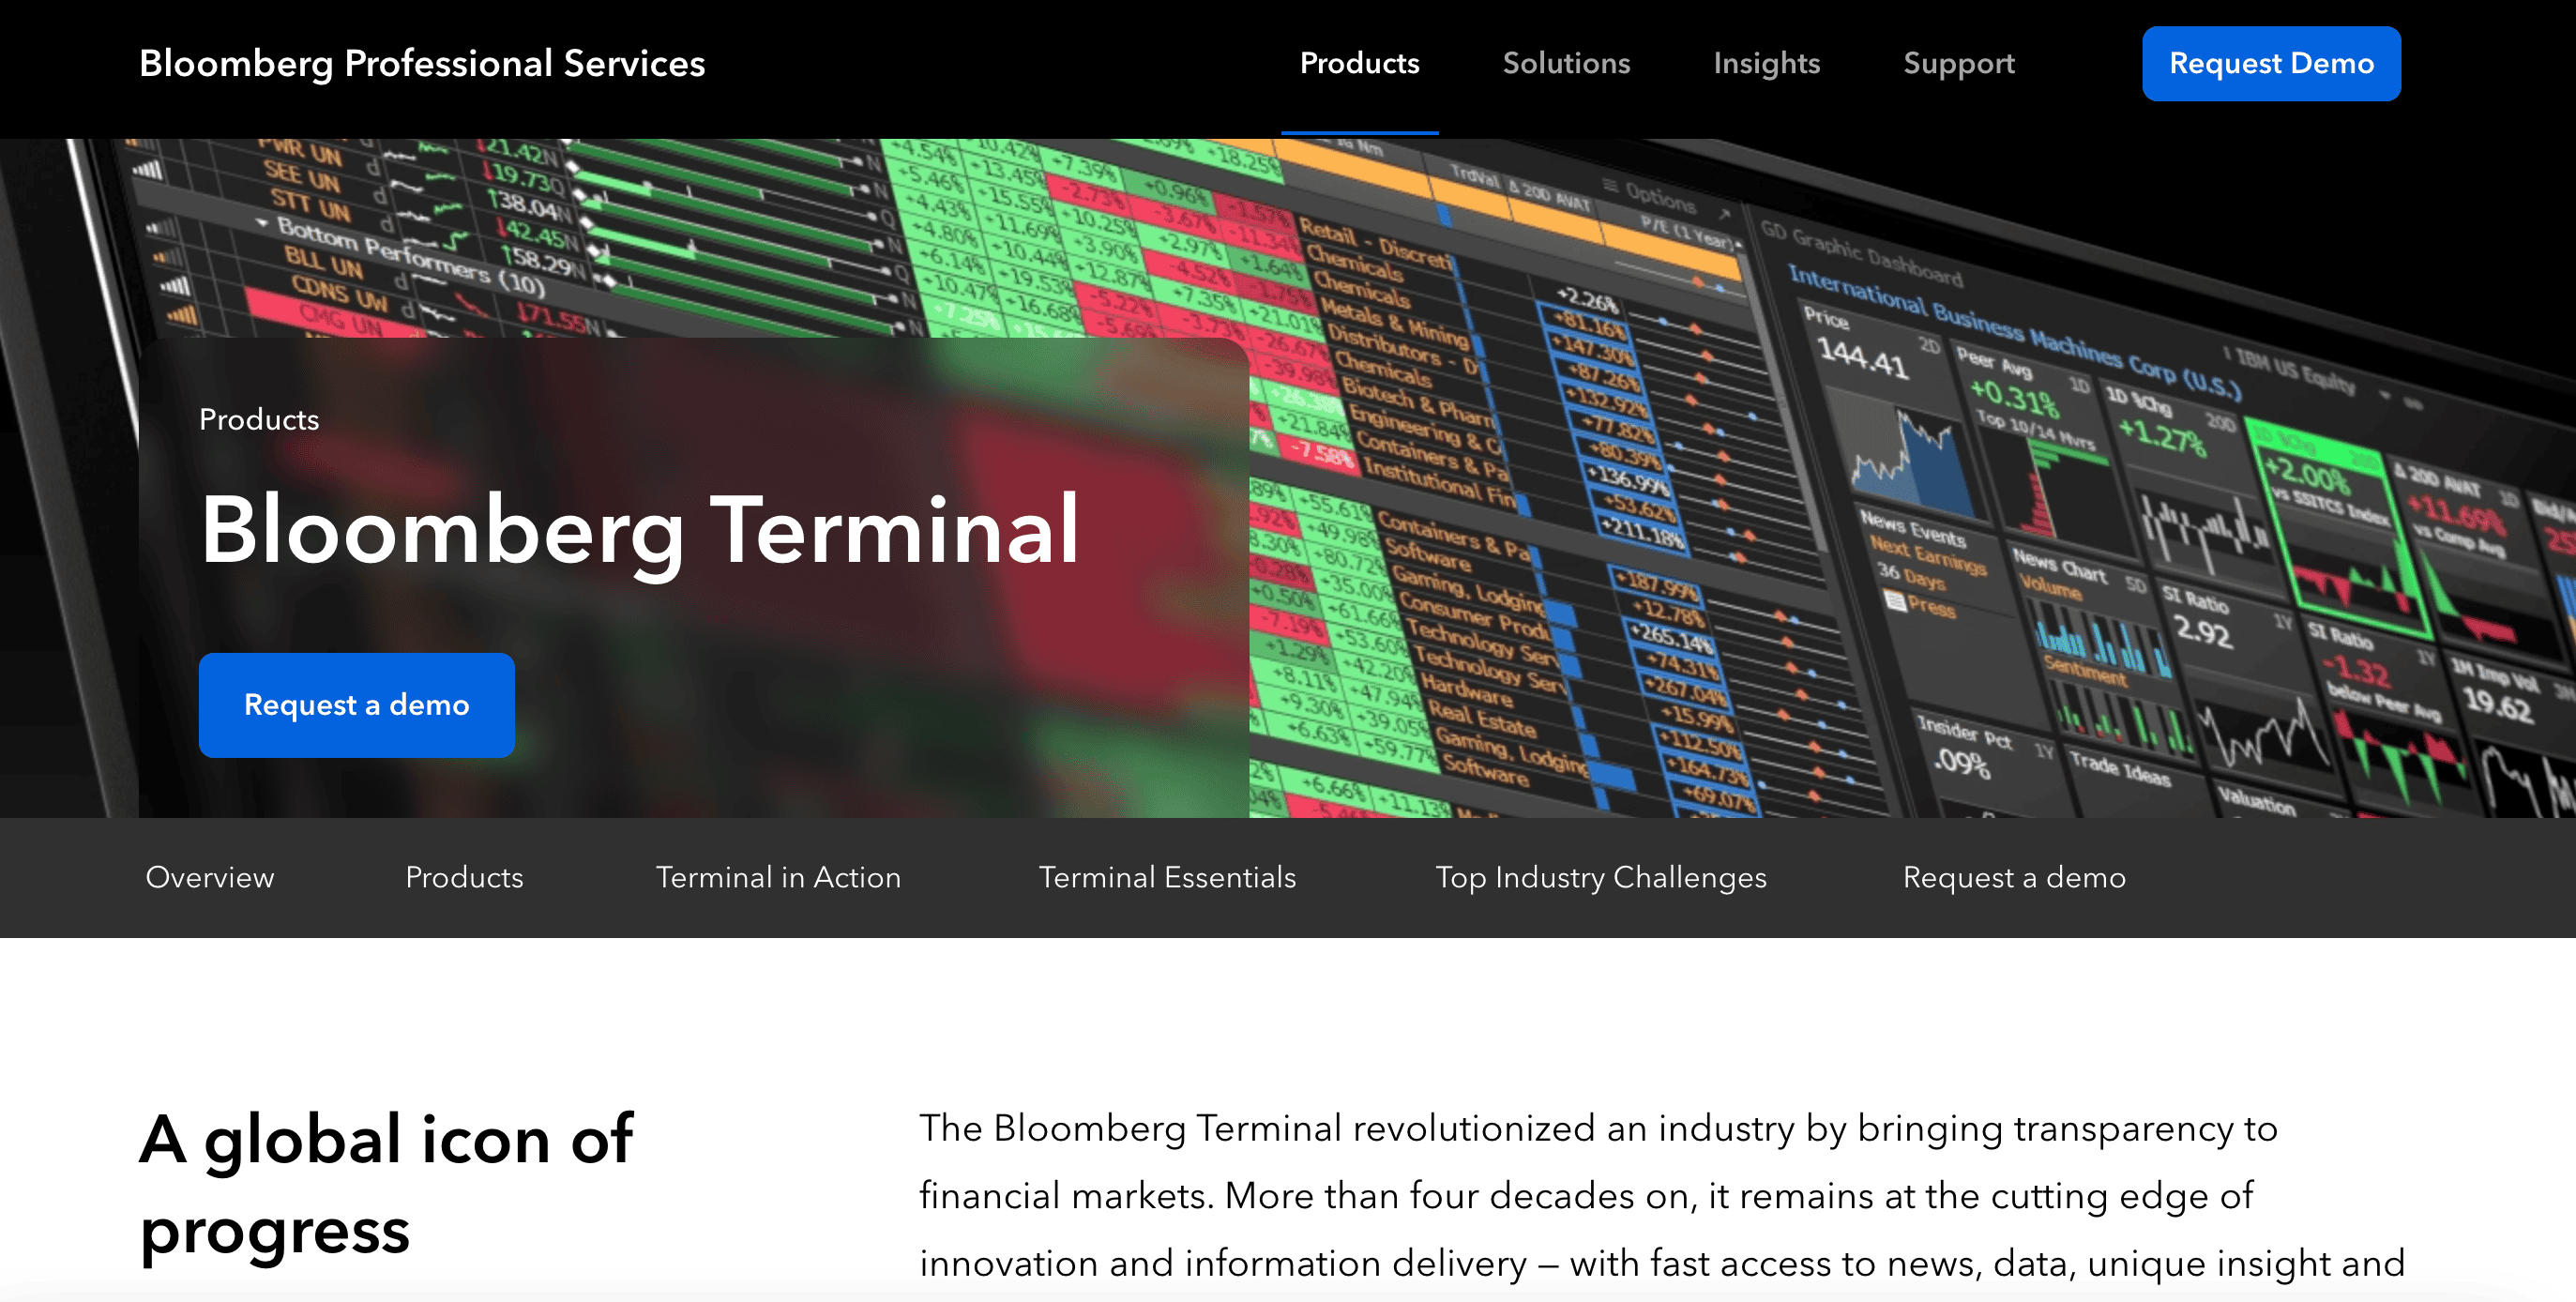
The Bloomberg Terminal is a financial data and analytics platform that provides real-time market data, news, and analytics for equities, fixed income, commodities, derivatives, and more. It is one of the most established tools for professional investors, with in-depth financial reporting and access to global markets. The terminal integrates news feeds, historical data, and financial modeling tools in one platform, supporting portfolio management, research, and trading decisions.
Best for
Both data analysts who need accurate and timely information, and portfolio managers who need to track investments and market conditions in real time. Widely used for macroeconomic analysis, company financials, and sector insights.
Top features
- Real-time market data: Instant access to up-to-the-minute market prices, news, and trading data.
- Customizable financial models: Create and adapt detailed financial models, including DCF, relative valuation, and other methodologies.
- Advanced analytics: Sophisticated charting and technical analysis tools for both macroeconomic and microeconomic research.
Pricing
Bloomberg Terminal is priced at approximately $20,000 to $25,000 per user annually, with additional costs for specialized data feeds or extended functionalities.
See popular Bloomberg Terminal alternatives for more options.
8. CapitalCube
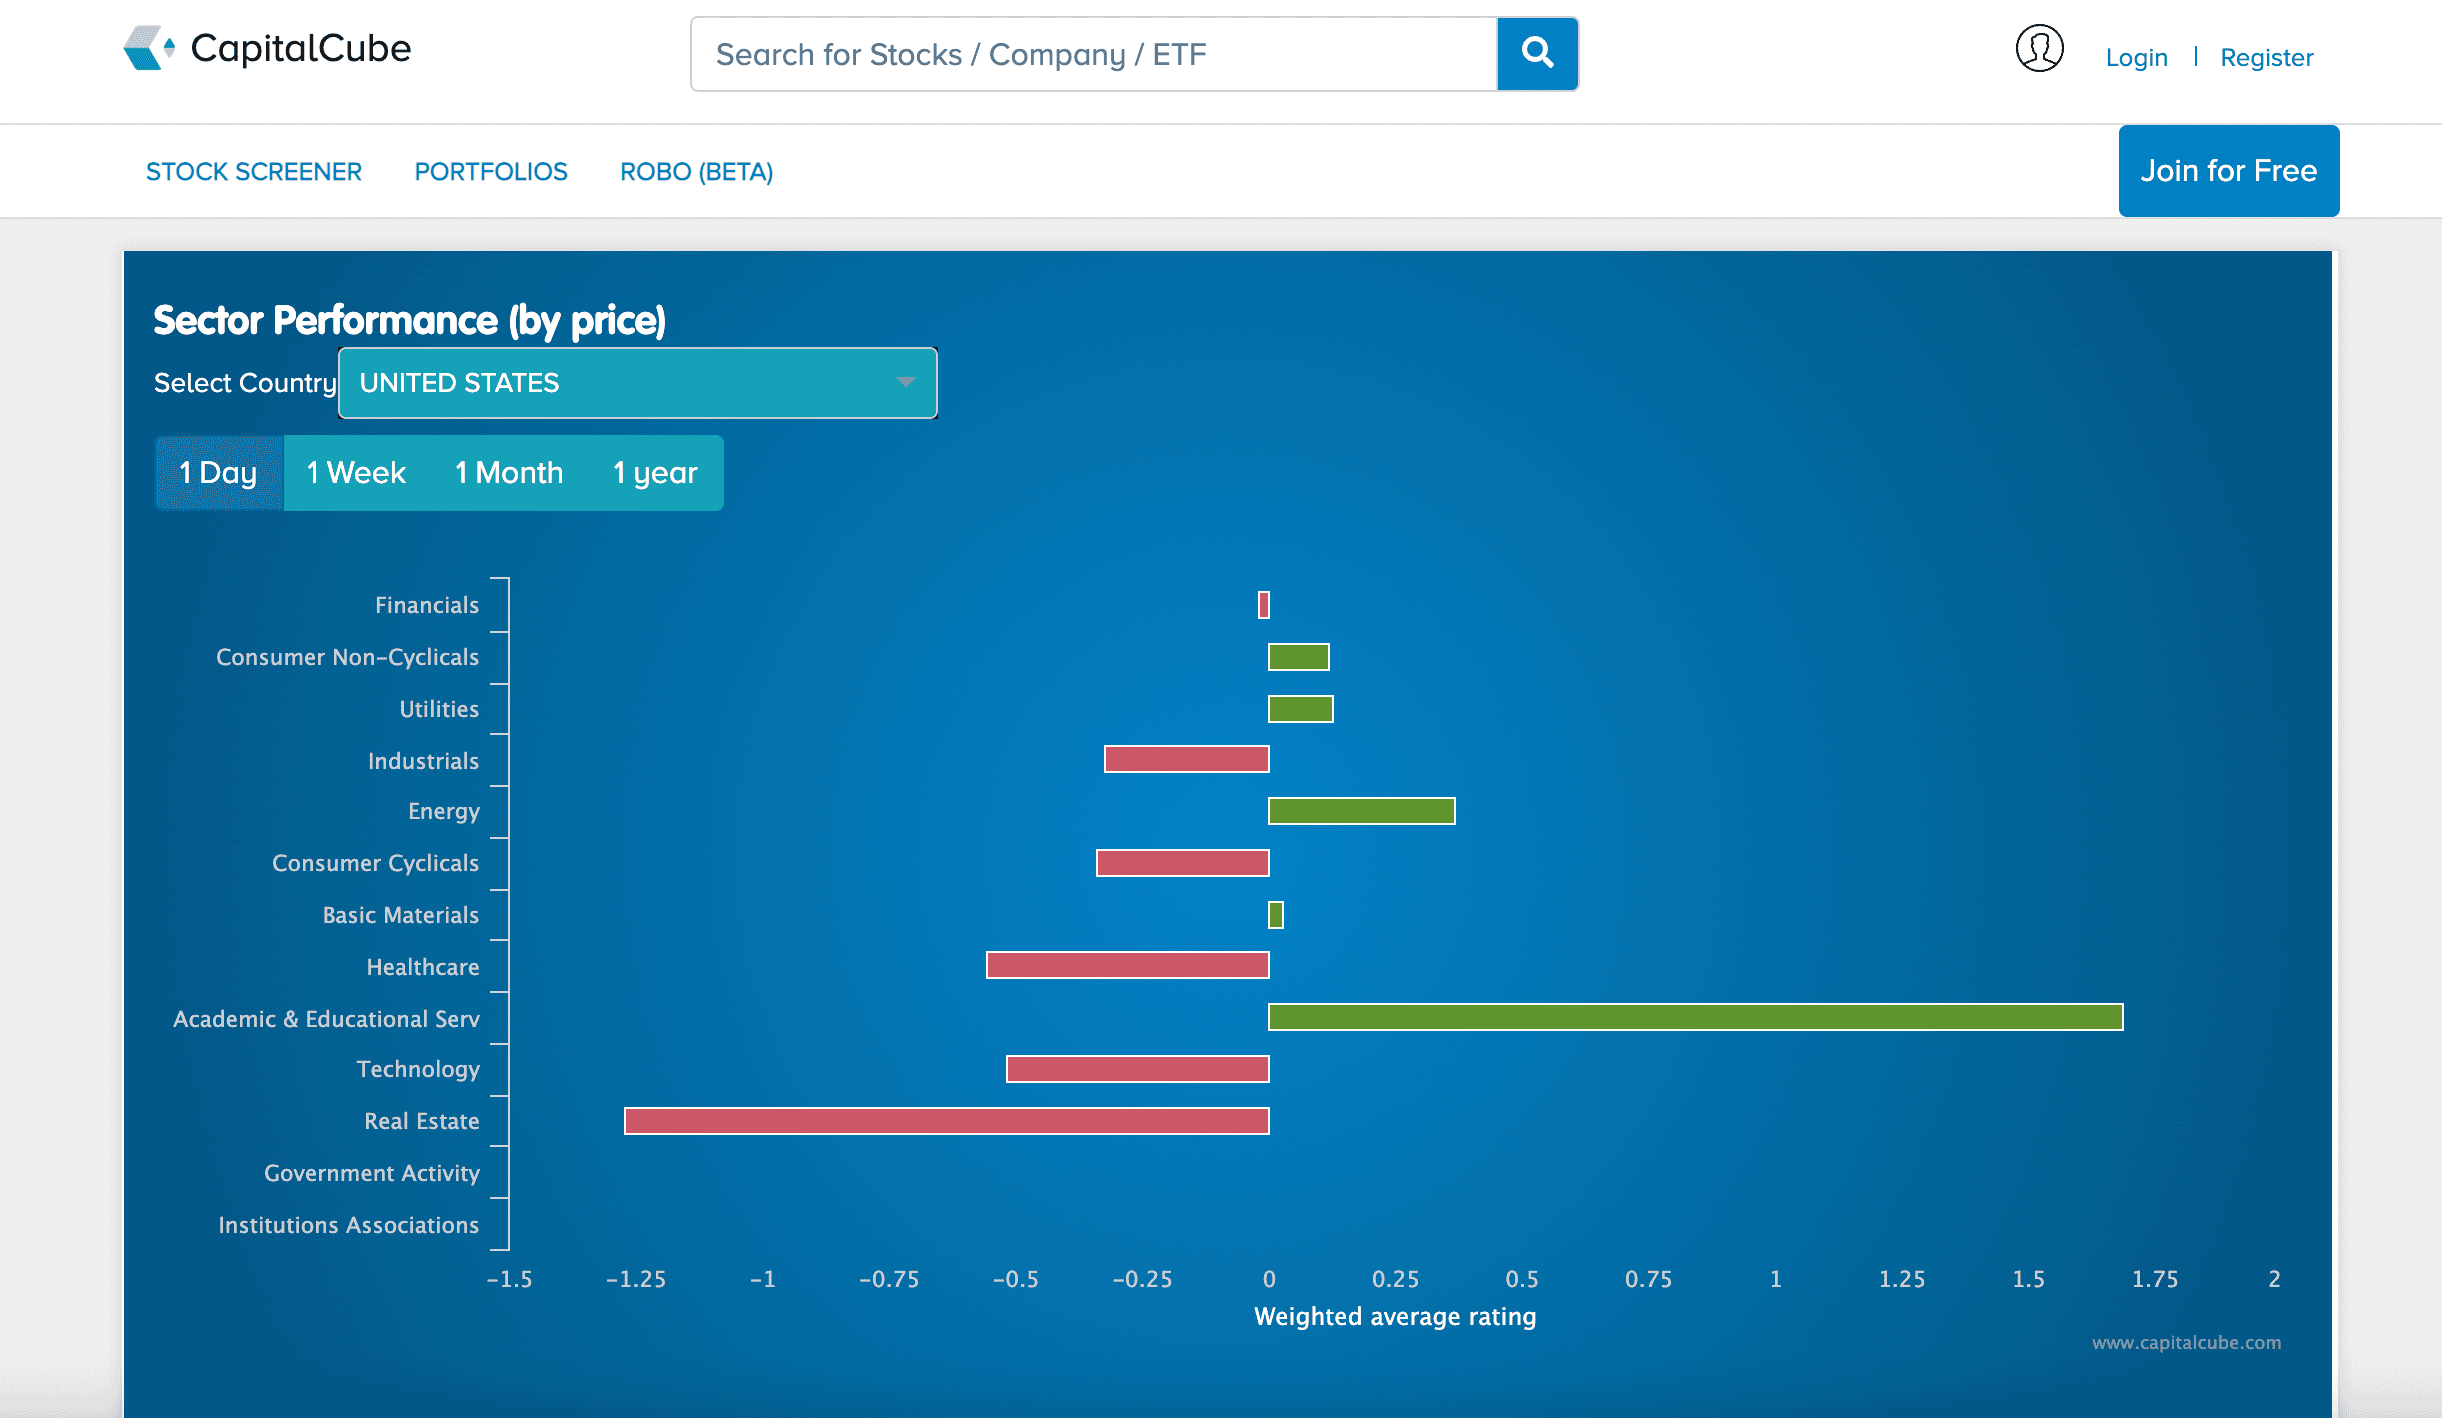
CapitalCube offers an advanced data analytics platform that specializes in analyzing the financial performance and valuation of publicly traded companies. It uses a combination of machine learning and financial modeling techniques to provide high-level insights, which is particularly useful for automated equity analysis.
Best for
Analysts who need to conduct automated fundamental analysis and generate stock ratings and insights based on financial metrics. Its platform can save time on manual analysis by providing ready-to-use models and reports.
Top features
- Automated financial analysis: Uses machine learning to automate financial analysis and rating generation.
- Valuation models: Provides pre-built models for valuation, including DCF and multiples-based approaches.
- Extensive metrics: Includes a wide range of metrics for evaluating companies' financial health and valuation.
Pricing
CapitalCube offers a tiered pricing model starting at around $15,000 annually, depending on the number of users and data access needs.
Equity research tools FAQ
What should I look for in an equity research tool?
Start with data depth in your coverage area, then look at screening and charting quality, workflow integration, and asset class support. If you also need unstructured web data (IR pages, press releases, regulatory filings), a web monitoring tool like Visualping plugs into the gaps that traditional terminals miss.
How do equity research tools differ from general stock screeners?
Stock screeners filter by numbers: P/E ratio, market cap, volume. Equity research tools go deeper. They bundle financial modeling, document search, risk analysis, and qualitative data on management and strategy. The CFA Institute's equity research framework outlines why both quantitative screening and qualitative analysis are essential for sound investment decisions. Most tools in this list offer both capabilities, while free screeners typically cover only the filtering side.
Can I use free equity research tools for professional analysis?
Free tiers exist (Koyfin, some screeners), but they cap data depth, historical coverage, or export. Fine for casual research. Professional analysts at hedge funds and asset managers almost always need paid plans for the speed, depth, and integration that high-conviction decisions demand.
How does web monitoring complement traditional equity research?
Traditional terminals aggregate structured data feeds. Web monitoring fills the gaps by tracking unstructured sources: company websites, SEC filings, government portals, and niche industry pages. These sources often update before the data hits terminal feeds. See tracking websites for investments for practical examples.
What is the most cost-effective equity research tool?
It depends on your needs. Koyfin offers a free tier with strong charting and global data. Visualping starts at $50/month and monitors any public web source. YCharts starts at $600/month with detailed visualization. Bloomberg Terminal and FactSet sit at the high end ($12,000 to $25,000/year) but offer the deepest data coverage for institutional teams.
Go deeper: Event-Driven Investing with Web Data | AI Investment Research Tools | Stock Research Tools
Conclusion
Which tools you need depends on your coverage area, budget, and data sources. Bloomberg and FactSet handle structured market data and modeling. YCharts and Koyfin sharpen your presentations. Visualping catches the IR page updates, regulatory filings, and company website changes that surface before they reach any terminal feed.
If your research stack has blind spots on the unstructured web, explore Visualping's pricing or get in touch to see how it fits.
Want to uncover leading market signals?
Monitor any web source online, and get notified of market-moving events, with Visualping.
The Visualping Team
The Visualping Team tracks web changes for over 2 million users across competitive intelligence, compliance monitoring, and automated workflows.